Why Has Consumer Spending Remained So Resilient? Evidence from Credit Card Data 


Federal Reserve Bank of Boston
The views expressed herein are solely those of the authors and should not be reported as representing the views of the Federal Reserve Bank of Boston, the principals of the Board of Governors, or the Federal Reserve System.
Despite elevated interest rates, rising uncertainty surrounding trade and fiscal policy, and declining consumer sentiment, consumer spending, which represents almost 70 percent of US GDP, has remained strong. We use large-scale, detailed credit card data from the last 10 years to look for an explanation for this resilience and to learn whether cracks may be forming, and if so, where. These data enable us to study spending activity and exposure to financial constraints across different income groups and geographic areas.
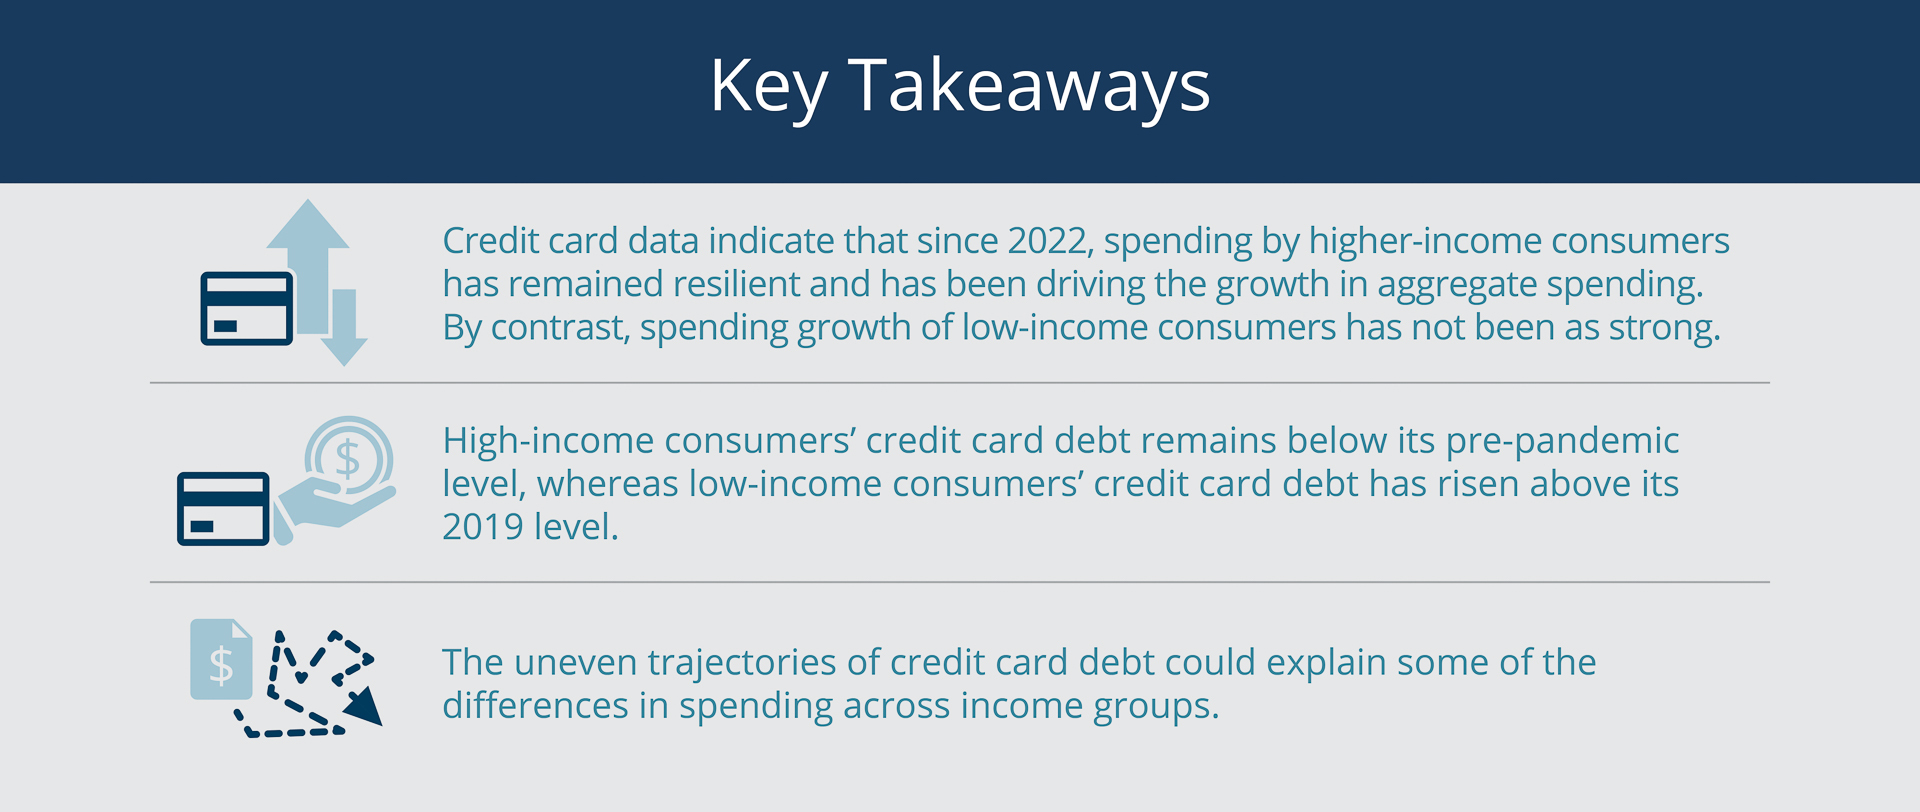
We find that since 2022, real aggregate spending—overall spending adjusted for inflation—has been propelled by the highest-income consumers. We also find that while inflation-adjusted credit card debt held by high-income consumers has yet to catch up to the level that prevailed before the pandemic, low-income consumers now have substantially higher levels of credit card debt than they did in 2019. In addition, we find that the gap between high- and low-spending US counties has remained stable over our 10-year study window.
Sign up for Research Department Updates.
Taken together, these findings indicate that lower levels of credit card debt for higher-income consumers have supported strong spending growth. By contrast, spending growth for low-income consumers has been much weaker.
Data Indicate Higher-income Consumers Are Driving Spending Growth
We use data from the Federal Reserve Y-14M schedules for credit cards, which include, among other information about credit card accounts issued by the largest US banks, each cardholder’s monthly spending, credit card debt balances, interest charges and fees, Zip code, and income when the account was opened.1 These data cover about 80 percent of credit card balances in the United States.2 Our analysis relies on a 1 percent sample of accounts from the Y-14M that have debit, credit, or balance activity in the preceding 12 months. Our sample excludes business and corporate credit cards.3
Account-holder income is recorded in the Y-14M data when the account is opened, but it is unobserved (that is, not included in the data) thereafter, unless the account holder updates their income. A key contribution of our analysis is that we are able to predict missing account-holder income. We do this by first dividing the data on observed real income values (that is, at account opening or when we see income updates) into five equally sized groups. We then model the relationship between observed income and a set of detailed account-level characteristics such as spending levels and credit limits. Finally, we use our model to predict the account holder’s income group whenever it is missing. We provide further details about our methodology in Appendix A.
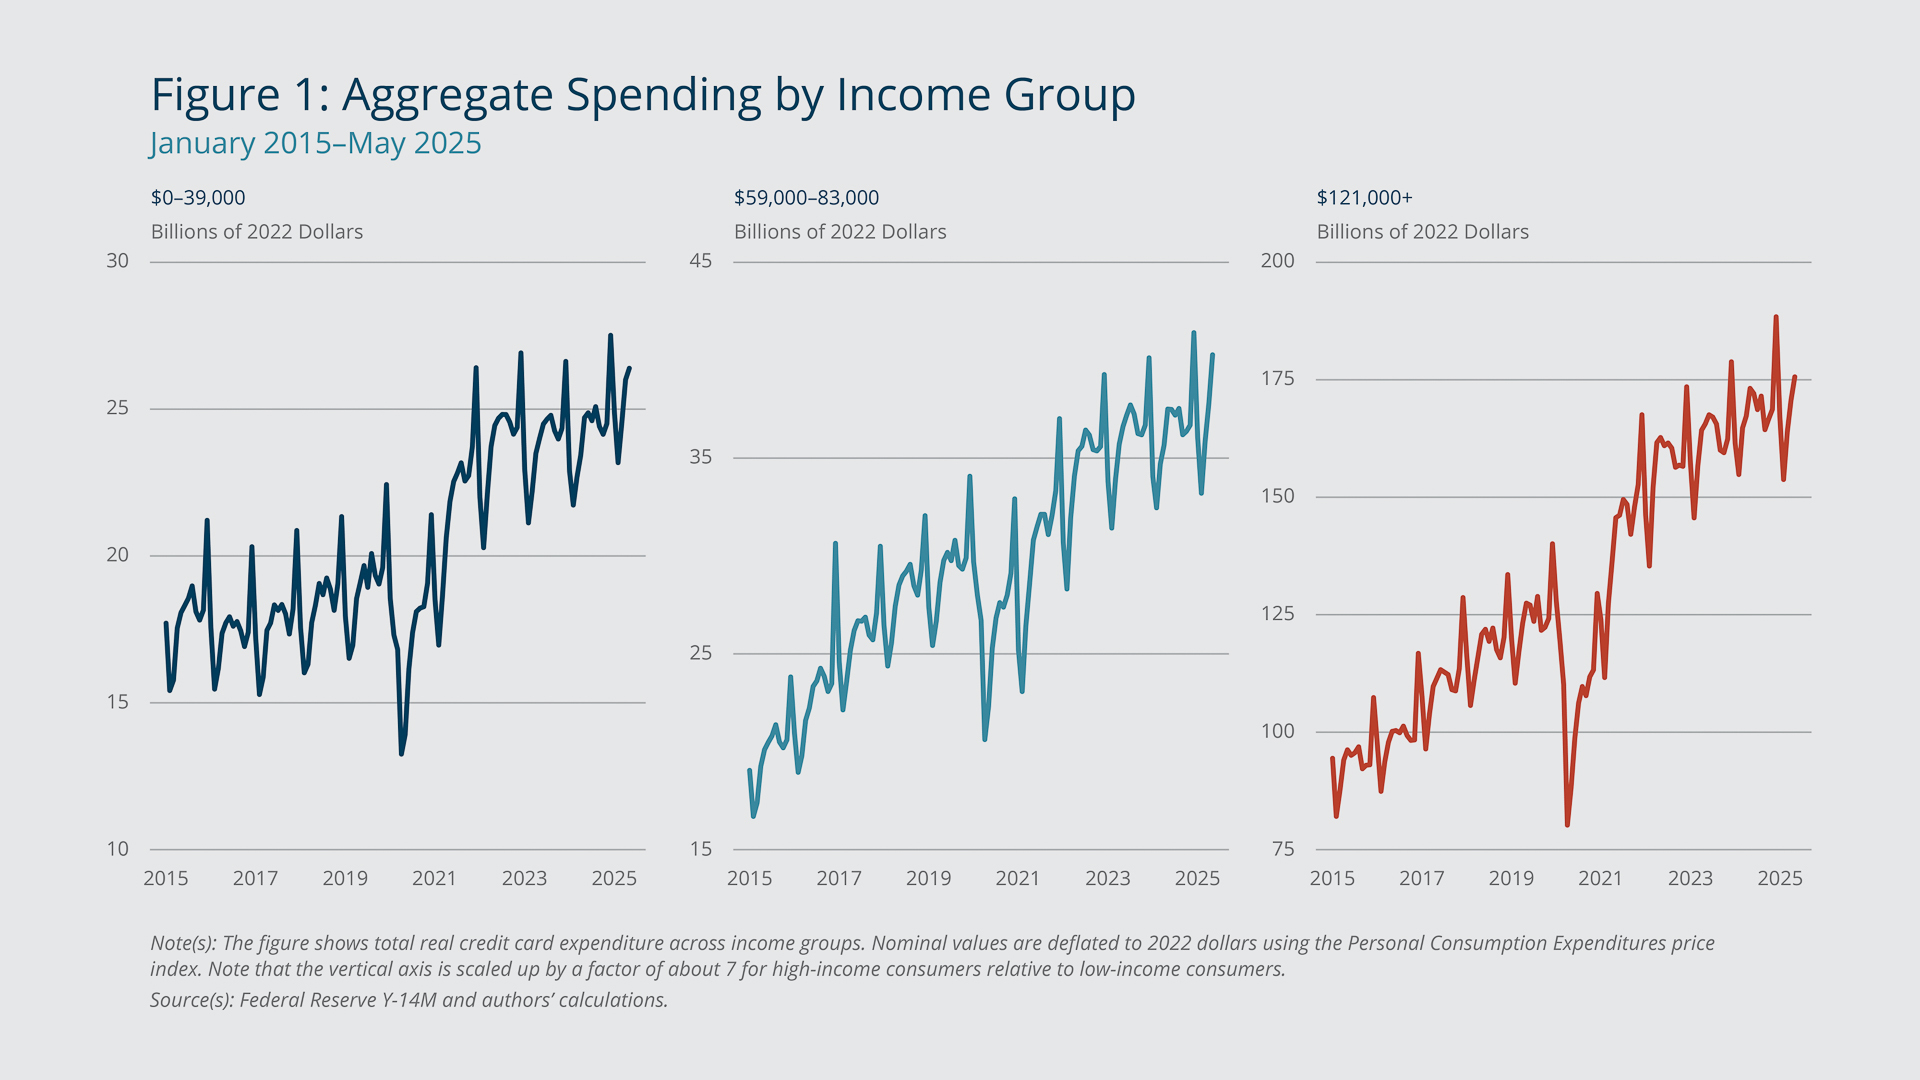
Figure 1 shows total real credit card expenditure from January 2015 through May 2025 for low-, middle-, and high-income groups (specifically, real income ranges representing the first, third, and fifth quintiles of our data set). In this figure and all subsequent figures, nominal values are deflated to 2022 dollars using the Personal Consumption Expenditures (PCE) price index. (Note that the vertical axis is scaled up by a factor of about 7 for high-income consumers relative to low-income consumers.)
Federal Reserve Bank of Boston
Each panel shows clear seasonal patterns in spending activity: a spike during the winter holiday season, a trough in the first quarter, and some resurgence in the summer months. More to the point, comparing the three panels shows that real (inflation-adjusted) spending by the lowest-income consumers increased sharply in 2021 and 2022 and has grown only modestly since then, whereas real spending growth by the higher income groups—especially the top earners—has remained robust. These findings indicate that recent growth in aggregate spending, which sums across all income groups, has been propelled by the highest-income consumers.4
The Gap between High- and Low-spending Counties Has Remained Stable
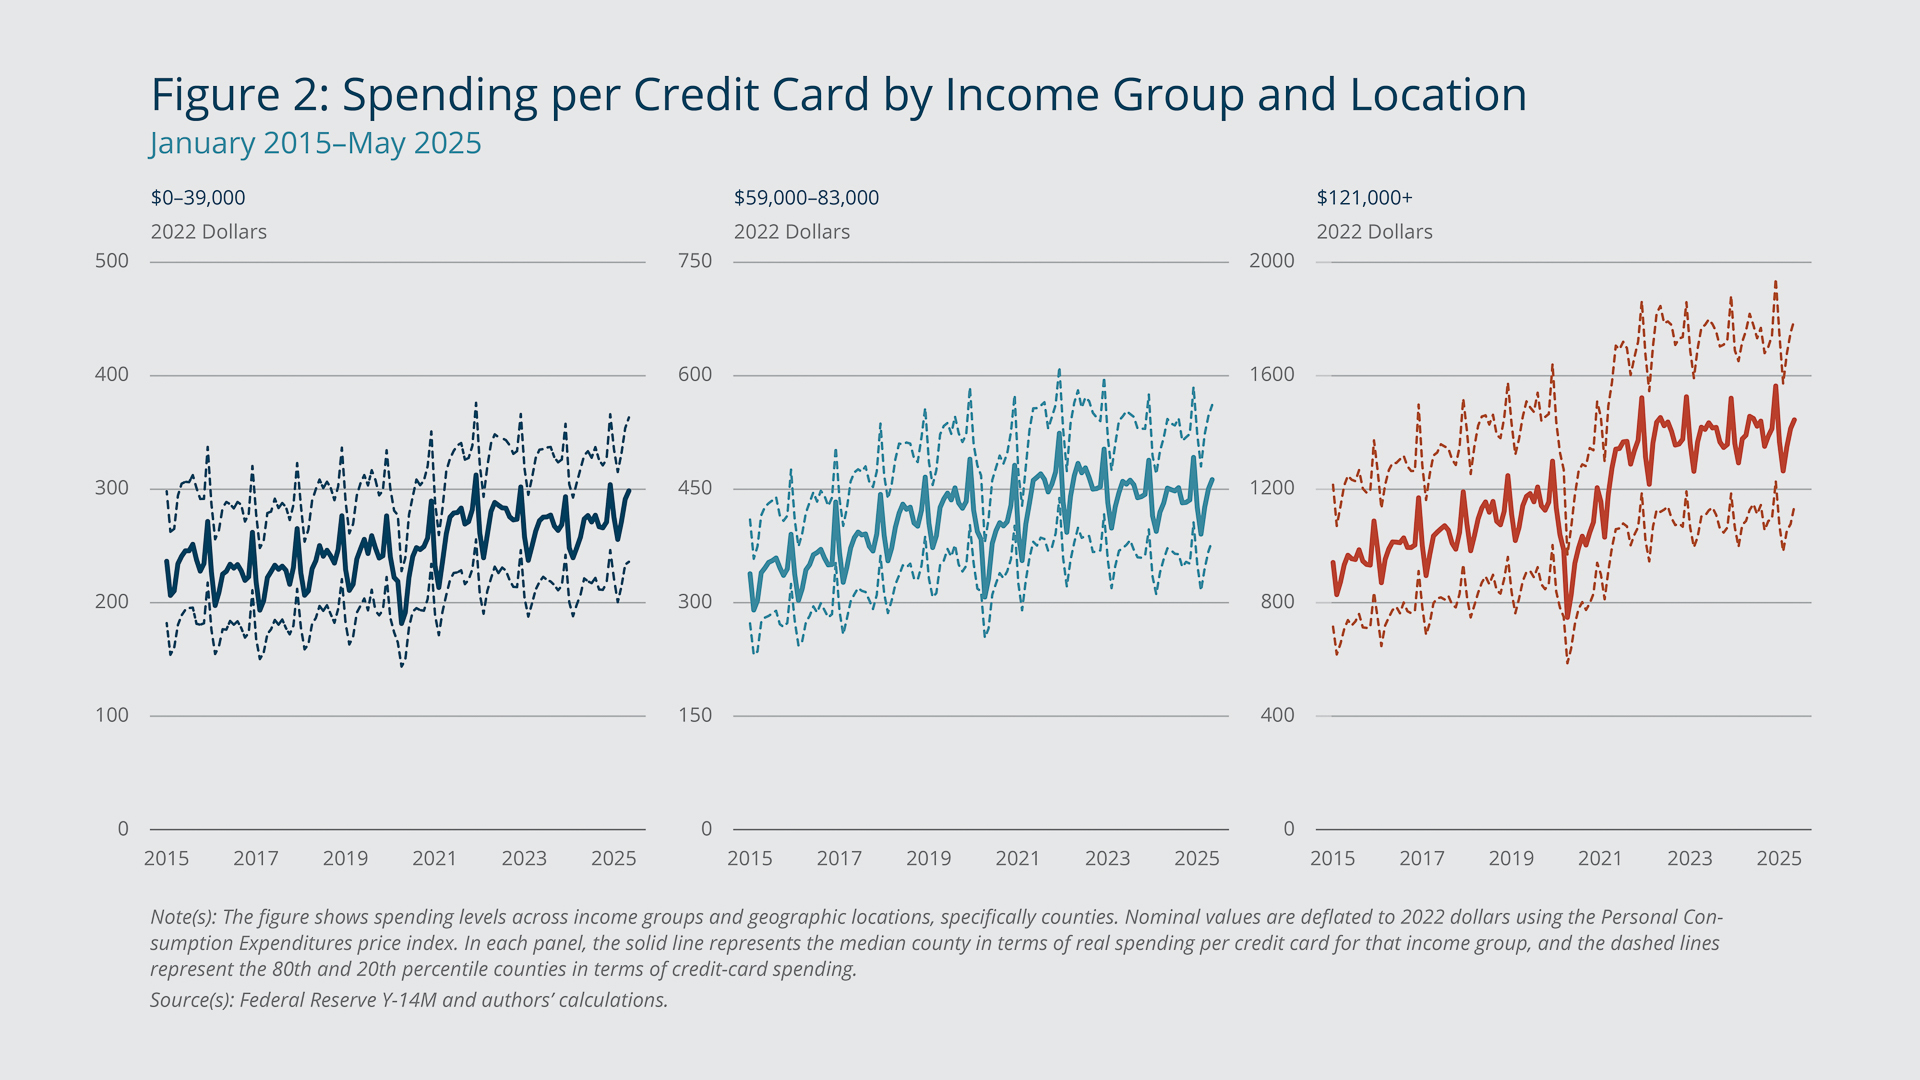
Figure 2 shows spending levels across income groups and geographic locations, specifically counties. It indicates that for all income groups, the gap between low- and high-spending counties has changed little over time.
Federal Reserve Bank of Boston
In this analysis, we remove variation arising from differences in population size across counties by reporting statistics on a per-card basis. Importantly, the structure of our data allows us to examine variation in outcomes by income group and county as opposed to relying on county-level per capita income as a proxy for individual income.5
In each panel of Figure 2, the solid line represents the median county in terms of real spending per credit card for that income group, and the dashed lines represent the 80th and 20th percentile counties in terms of credit card spending. The spread between the dashed lines therefore represents the difference between high- and low-spending US counties for each of the three income groups. This gap could arise due to location-based differences in consumer preferences, expectations of future economic conditions, wage growth, home-equity growth, access to credit, and so on.6
The left panel shows that real spending activity per card among low-income consumers increased in 2021 to just under $300 per month in the median county. It has remained near that level, which is a step up from the levels prevailing in 2019. The middle panel shows that middle-income consumers also exhibited strong spending growth in 2021 followed by a more recent reversion back to the pre-pandemic level of about $450 per month on a per-card basis. High-income consumers, shown in the right panel, raised their spending to about $1,400 per month on a per-card basis in 2021 and had sustained that level as of May 2025.
Comparing the trajectories in Figure 1 with those in Figure 2 shows that for each income group, per-card spending has grown less than overall credit card spending. This is consistent with overall spending for a given income group being distributed across more cards.
The 80–20 spread in each panel of Figure 2 shows a relatively stable trend—for each income group, the spending activities of the median-spending, high-spending, and low-spending counties have increased or decreased at about the same time and by roughly the same degree. Put differently, the figure indicates that if there are local differences in optimism or pessimism about future conditions or other locally driven changes, they have not translated into differences in spending activity.
High-income Consumers’ Credit Card Debt Has Not Caught Up to Its Pre-pandemic Level
Figure 3 shows total real credit card debt (for cards that revolve balances from month to month).7 As in Figure 1, the different panels show consumers in different income groups. The left panel shows that real credit card debt for low-income consumers trended up from 2015 to 2019. Debt levels fell about 15 percent from approximately $80 billion in 2019 to $65 billion in 2021, but these declines have reversed, and the current (as of April 2025) level is close to the level implied by the pre-pandemic trend—the level that would have prevailed if credit card debt had continued to grow at the pre-pandemic pace.
Federal Reserve Bank of Boston
The middle panel shows that middle-income consumers’ real credit card debt declined from about $100 billion in 2019 to roughly $75 billion in 2021. While this 20 percent drop is larger than the 15 percent drop for low-income consumers, real credit card debt for this group has grown rapidly from the pandemic-era lows and is now above the 2019 level.
The right panel shows that high-income consumers’ real credit card debt levels fell from about $190 billion in 2019 to $140 billion in 2021. This decline of more than 25 percent is the largest of the three income groups. Notably, credit card debt for this income group remains below the 2019 high and is well below the level implied by the pre-pandemic trend.
The Potential Effect of Pandemic-era Excess Savings
The trajectories of credit card debt shown in Figure 3 mirror some of the patterns of pandemic-era excess savings, which rose not only due to generous income-support programs in 2020 and 2021 (including the three rounds of stimulus payments) but also because of lockdown-induced declines in consumer spending. These excess savings fell as consumers spent down the cash they had accumulated. Many studies conclude that the excess savings have been depleted,8 and our findings indicate that some of these savings were used to pay off debt. This is the likely reason for the sharp reductions in the level of credit card debt that we observe in the wake of the pandemic. Notably, the fact that credit card debt levels for the highest-income consumers are currently well below the pre-pandemic trend implies that these consumers have room to spend out of unused credit even if their cash on hand has been depleted.
Compared with high-income consumers, credit card debt for low-income consumers has increased more rapidly, and their spending growth since 2022 has not been as robust. Potential near-term shocks such as increases in the cost of living due to inflation or income losses from layoffs are therefore likely to curb spending activity and lead to delinquencies at the bottom of the income distribution, where financial constraints are tighter. The same shocks are likely to have less impact at the top of the income distribution, where there is still significant unused credit.
Two caveats are worth mentioning. First, low-income consumers rely more on debit cards and cash and less on credit cards to support their overall spending activity when compared with high-income consumers (see, for example, Greene et al. 2024). This means that our data capture a smaller share of overall expenditure for low-income consumers relative to high-income consumers. We believe that this coverage gap affects overall spending levels but is probably less important for spending trends.
Second, buy now pay later (BNPL) has emerged as a new form of credit that is more likely to be adopted by individuals with low credit scores (see, for example, Aidala et al. 2023 and Stavins 2024). It remains unclear how the interaction between BNPL debt and credit card debt will affect consumer spending activity going forward, especially at the bottom of the income distribution.
Endnotes
- More information about FR Y-14M reporting requirements is available at https://www.federalreserve.gov/apps/reportingforms/Report/Index/FR_Y-14M.
- Federal Reserve Bank of Philadelphia, Large Bank Credit Card and Mortgage Data, https://www.philadelphiafed.org/surveys-and-data/large-bank-credit-card-and-mortgage-data (accessed July 22, 2025).
- A significant advantage of the Y-14M data is that they allow us to construct an accurate and relatively timely measure of credit card spending, excluding fees and interest charges. This measure is error-free relative to those derived from credit bureau data, which often lack information on payments, interest, and fees, and therefore approximate credit card spending using monthly changes in balances (see, for example, Gibbs et al. 2025). Over the 2015–2025 sample period, the Y-14M data cover about 40 percent of total expenditure in the US Census Bureau's monthly retail trade survey (MRTS); the coverage rate rises to 50 percent when we exclude motor vehicles and motor vehicle parts sales from the MRTS. In Appendix Figure B1, we show that Y-14M spending tracks seasonal fluctuations well but exhibits faster growth than the MRTS.
- Our conclusion mirrors that of Hacioğlu-Hoke et al. (2024), who use survey data on household spending and, crucially, can disaggregate their sample using self-reported income.
- Hacioğlu-Hoke et al. (2025) show that using local proxies for individual income can mask important differences in spending activity across income groups.
- For instance, Mian et al. (2013) investigate the impact of local changes in housing net worth on local spending, Chodorow-Reich et al. (2021) study how local differences in stock ownership translate into local differences in economic activity including consumer spending, and Bakker et al. (2025) show that childhood exposure to hometown environments is an important determinant of future credit access as measured by credit scores.
- Due to a reporting change in May 2025, the data underlying this figure stop in April 2025.
- See, for example, Barbiero and Patki (2023), Abdelrahman et al. (2024a), and Abdelrahman et al. (2024b). Abdelrahman et al. (2024b) show that the liquid wealth component of pandemic-era excess savings was depleted faster by low-income households than by high-income households.
References
Abdelrahman, Hamza, Luiz Oliveira, and Adam Shapiro. 2024a. “The Rise and Fall of Pandemic Excess Wealth.” Federal Reserve Bank of San Francisco Economic Letter 2024-06.
Abdelrahman, Hamza, Luiz Oliveira, and Adam Shapiro. 2024b. “Pandemic-Era Liquid Wealth Is Running Dry.” Federal Reserve Bank of San Francisco Economic Letter 2024-21.
Aidala, Felix, Daniel Mangrum, and Wilbert van der Klaauw. 2023. “Who Uses ‘Buy Now, Pay Later’?” Federal Reserve Bank of New York Liberty Street Economics. September 26, 2023.
Bakker, Trevor J., Stefanie DeLuca, Eric A. English, James S. Fogel, Nathaniel Hendren, and Daniel Herbst. 2025. “Credit Access in the United States.” National Bureau of Economic Research Working Paper 34053.
Barbiero, Omar, and Dhiren Patki. 2023. “Have US Households Depleted All the Excess Savings They Accumulated during the Pandemic?” Federal Reserve Bank of Boston Current Policy Perspectives. November 7, 2023.
Chodorow-Reich, Gabriel, Plamen T. Nenov, and Alp Simsek. 2021. “Stock Market Wealth and the Real Economy: A Local Labor Market Approach.” American Economic Review 111 (5): 1613–1657.
Gibbs, Christa, Benedict Guttman-Kenney, Donghoon Lee, Scott Nelson, Wilbert van der Klaauw, and Jialan Wang. 2025. “Consumer Credit Reporting Data.” Journal of Economic Literature 63(2): 598–636.
Greene, Claire, Julian Perry, and Joanna Stavins. 2024. “Consumer Payment Behavior by Income and Demographics.” Federal Reserve Bank of Boston Research Department Working Papers No. 24-8.
Hacioğlu-Hoke, Sinem, Leo Feler, and Jack Chylak. 2024. “A Better Way of Understanding the US Consumer: Decomposing Retail Spending by Household Income.” Board of Governors of the Federal Reserve System FEDS Notes. October 11, 2024.
Hacioğlu-Hoke, Sinem, Leo Feler, and Jack Chylak. 2025. “Lost in Aggregation: Geographic Mismeasurement of Income and Spending.” Board of Governors of the Federal Reserve System Finance and Economics Discussion Series 2025-050.
Mian, Atif, Kamalesh Rao, and Amir Sufi. 2013. “Household Balance Sheets, Consumption, and the Economic Slump.” Quarterly Journal of Economics 128(4): 1687–1726.
Stavins, Joanna. 2024. “Buy Now, Pay Later: Who Uses It and Why.” Federal Reserve Bank of Boston Current Policy Perspectives No. 24-3.

 About the Authors
Rees Hagler,
Federal Reserve Bank of Boston
Rees Hagler is a senior research assistant in the Federal Reserve Bank of Boston Research Department.
Dhiren Patki,
Federal Reserve Bank of Boston
Dhiren Patki is a senior economist in the Federal Reserve Bank of Boston Research Department.
Email: Dhiren.Patki@bos.frb.org
Resources
Site Topics
Keywords
- consumer spending ,
- credit card debt ,
- household income
JEL Codes
- E21 ,
- G51
Citation
Hagler, Rees, and Dhiren Patki. 2025. “Why Has Consumer Spending Remained So Resilient? Evidence from Credit Card Data.” Federal Reserve Bank of Boston Current Policy Perspectives 25-10.