New England Economic Conditions Through April 22, 2025 


Key Takeaways
- Unemployment in New England was 4.0 percent in March 2025, which was slightly below the national rate of 4.2 percent but represents a year-over-year increase of 0.6 percentage point.
- US Bureau of Labor Statistics revisions to 2024 New England labor market data led to modest downward revisions to payroll employment and upward revisions to unemployment.
- Year-over-year price growth for March 2025 was faster in New England (3.2 percent) compared with the United States overall (2.4 percent). Annual inflation experienced a slowdown relative to price growth in the previous month, with slower growth in product categories including medical care, transportation, and shelter.
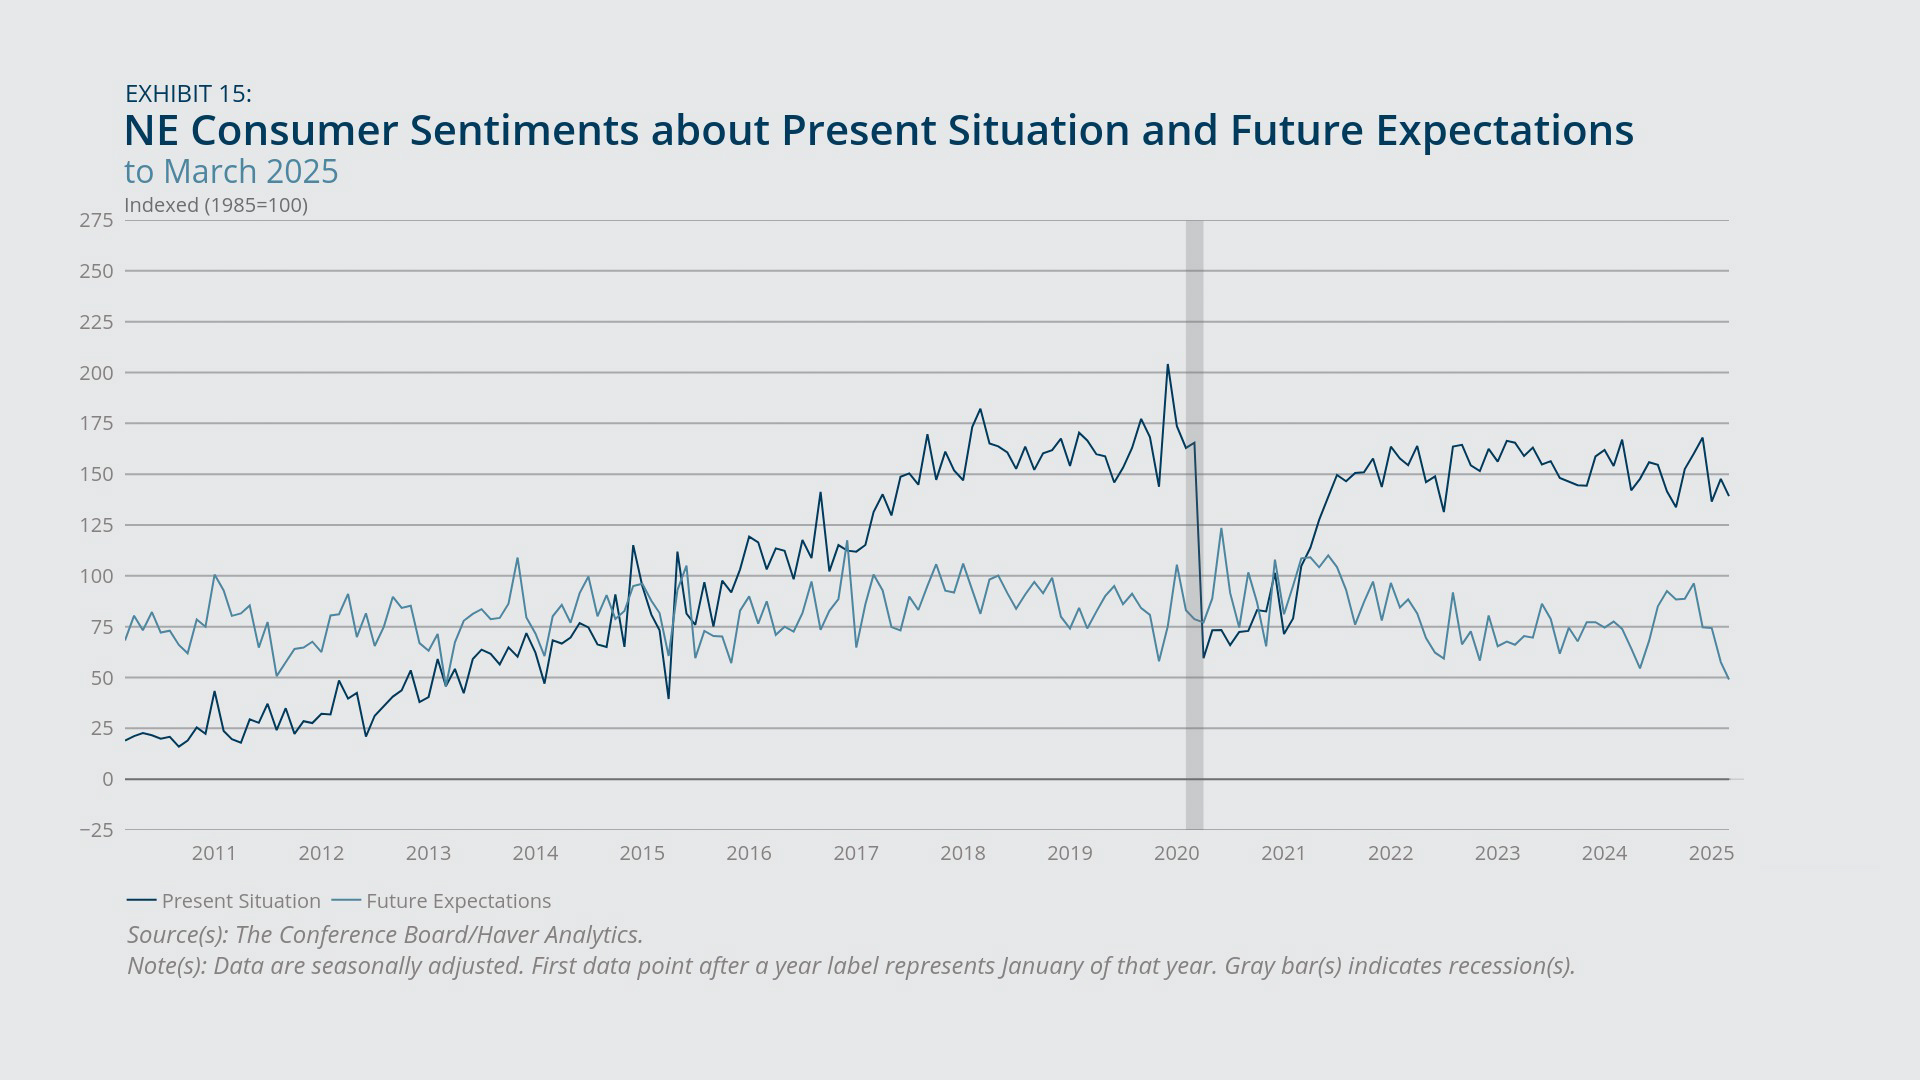
- Consumer confidence in both New England and the United States was lower in March 2025 compared with one year earlier, driven by a less positive outlook on the present as well as diminished expectations for the future. Regionally and nationally, consumers’ expectations for the future were at a 12-year low in March 2025.
Sign up for new research and data on the New England economy.
This memorandum reviews recent changes in economic conditions in New England based on the most recently available data. The memo also assesses the impact of revisions to some of the data analyzing labor markets. On March 17, 2025, the US Bureau of Labor Statistics (BLS) released its annual benchmark revisions of payroll employment data for states and select metropolitan areas. The BLS also released revisions of household survey measures of employment and unemployment.
Payroll Employment
- Payroll employment in New England grew year-over-year by just 0.1 percent in March 2025 and remained above its pre-pandemic employment benchmark, with the region gaining 3,000 jobs during the month.
- While employment over the past year has experienced positive growth in the education and health services sector and the leisure and hospitality sector, negative job growth in the information, construction, and manufacturing sectors has helped hinder total employment growth in New England.
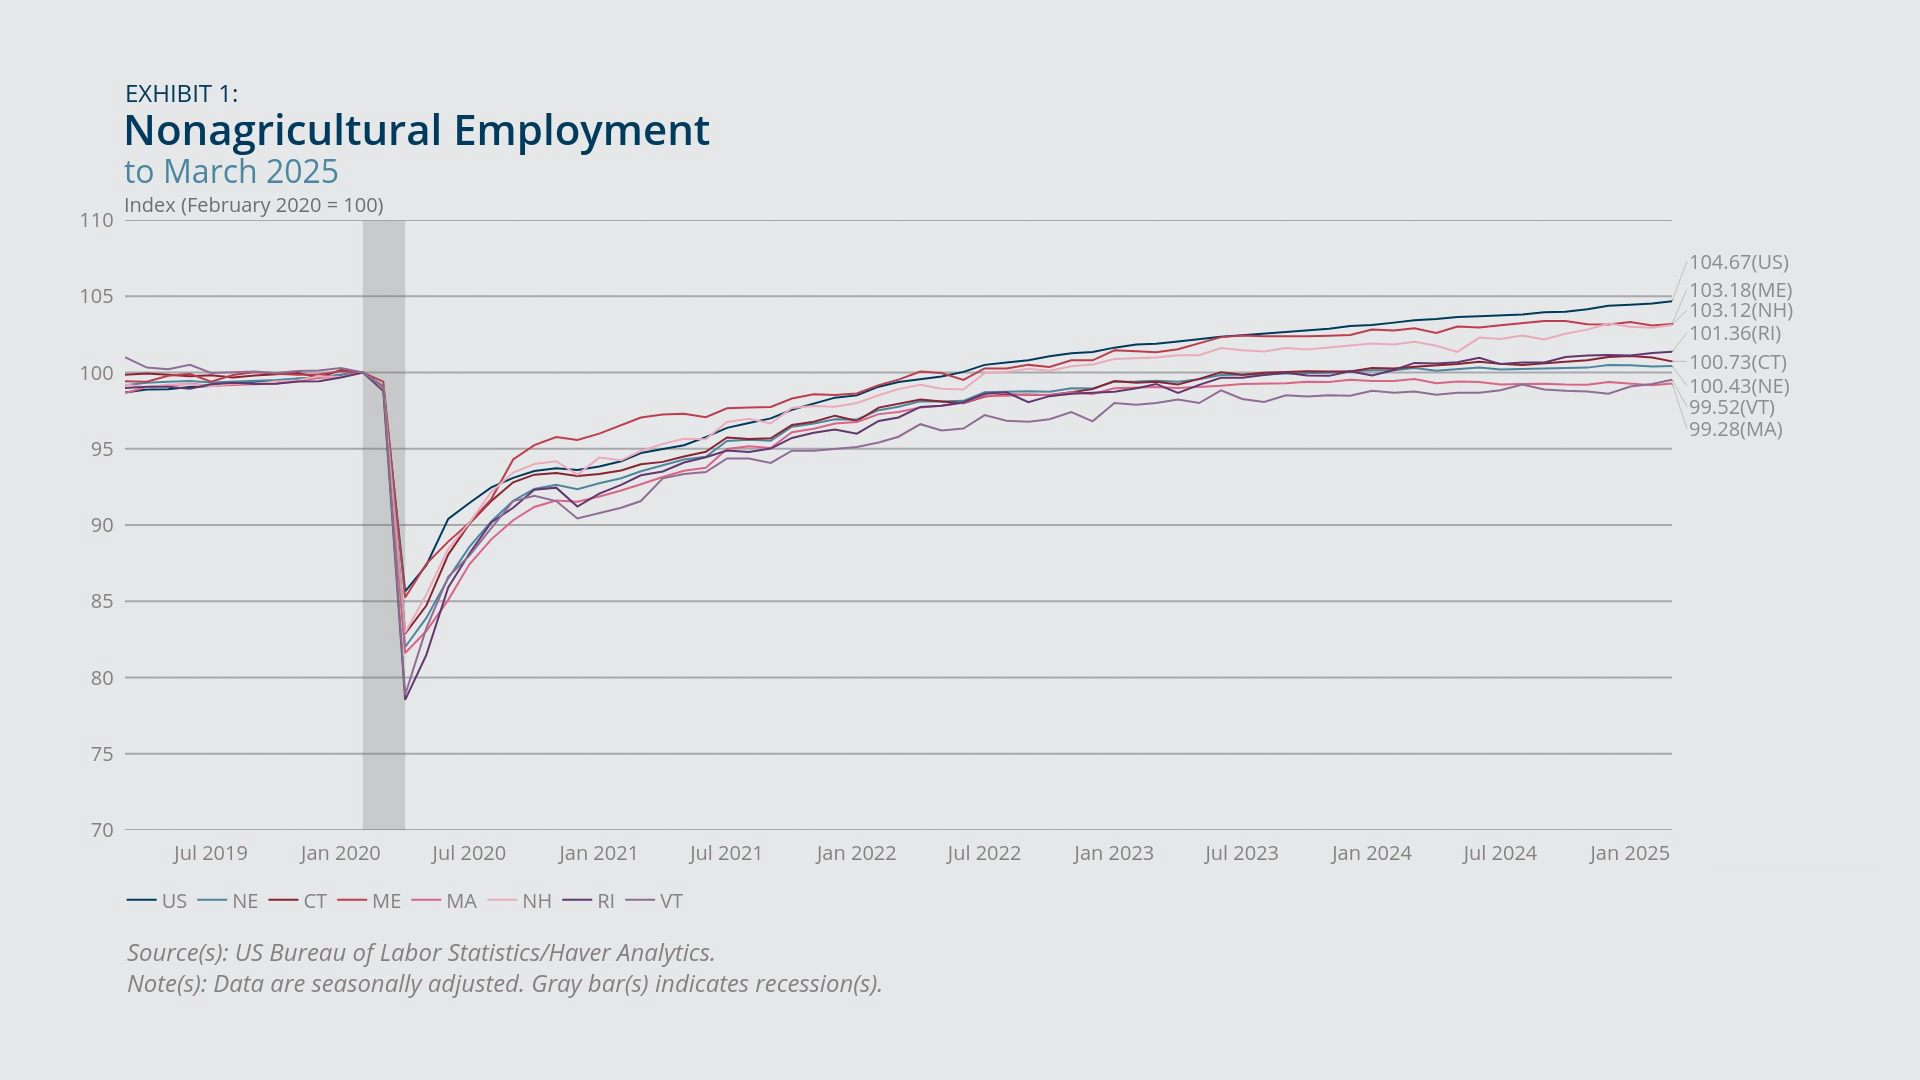
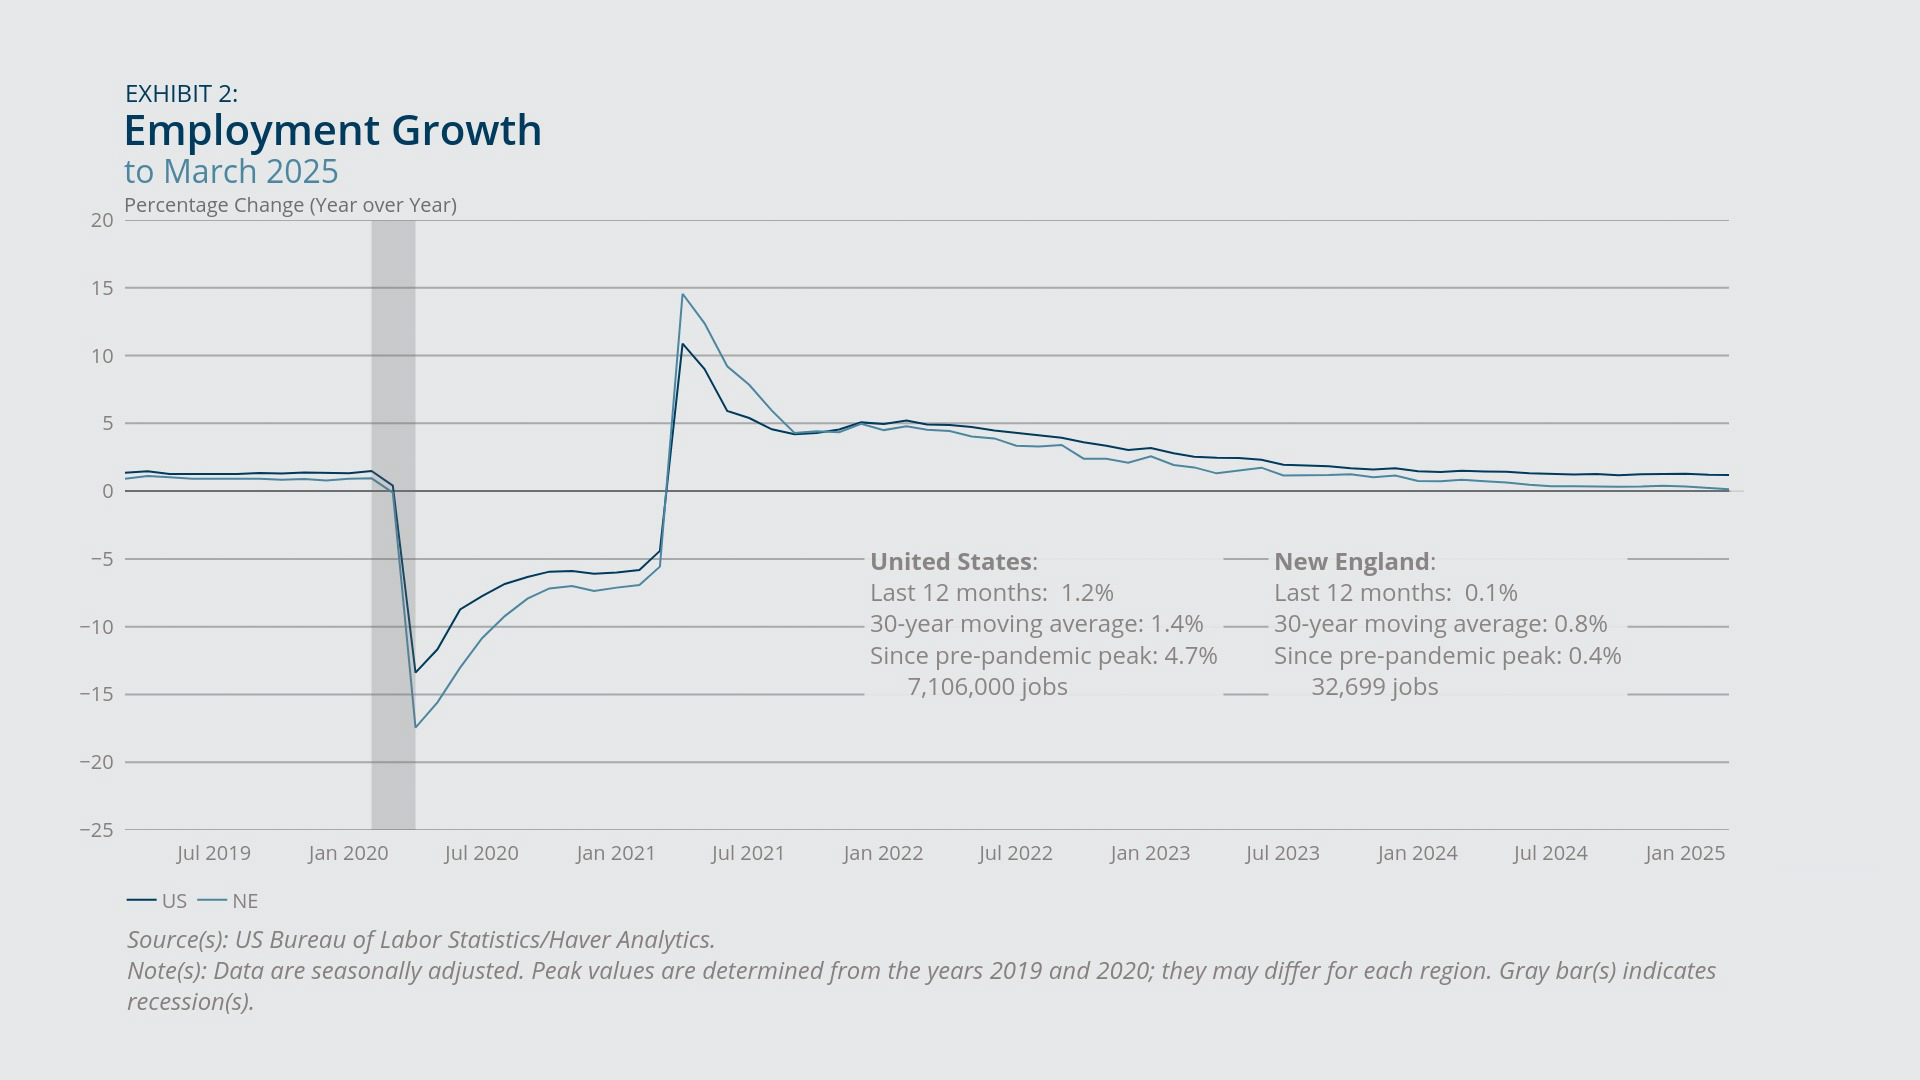
New England once again exceeded its pre-pandemic payroll employment level in March 2025 (Exhibit 1), gaining 3,000 jobs during the month (not shown). Employment growth from February 2020 to March 2025 remained slower in the region (0.4 percent) than in the nation as a whole (4.7 percent). New England exhibited more sluggish employment growth over the past year, with recent growth once again lagging corresponding year-over-year growth in the United States (0.1 percent versus 1.2 percent) (Exhibit 2). Employment in four New England states was higher than pre-pandemic levels, led by the growth rates in Maine and New Hampshire (3.2 percent and 3.1 percent higher employment than February 2020 levels in those states, respectively). However, even those growth rates were lower than the corresponding national rate. Meanwhile, employment in Vermont and Massachusetts was lower than pre-pandemic levels (0.5 percent and 0.7 percent lower employment than February 2020 levels in those states, respectively).1
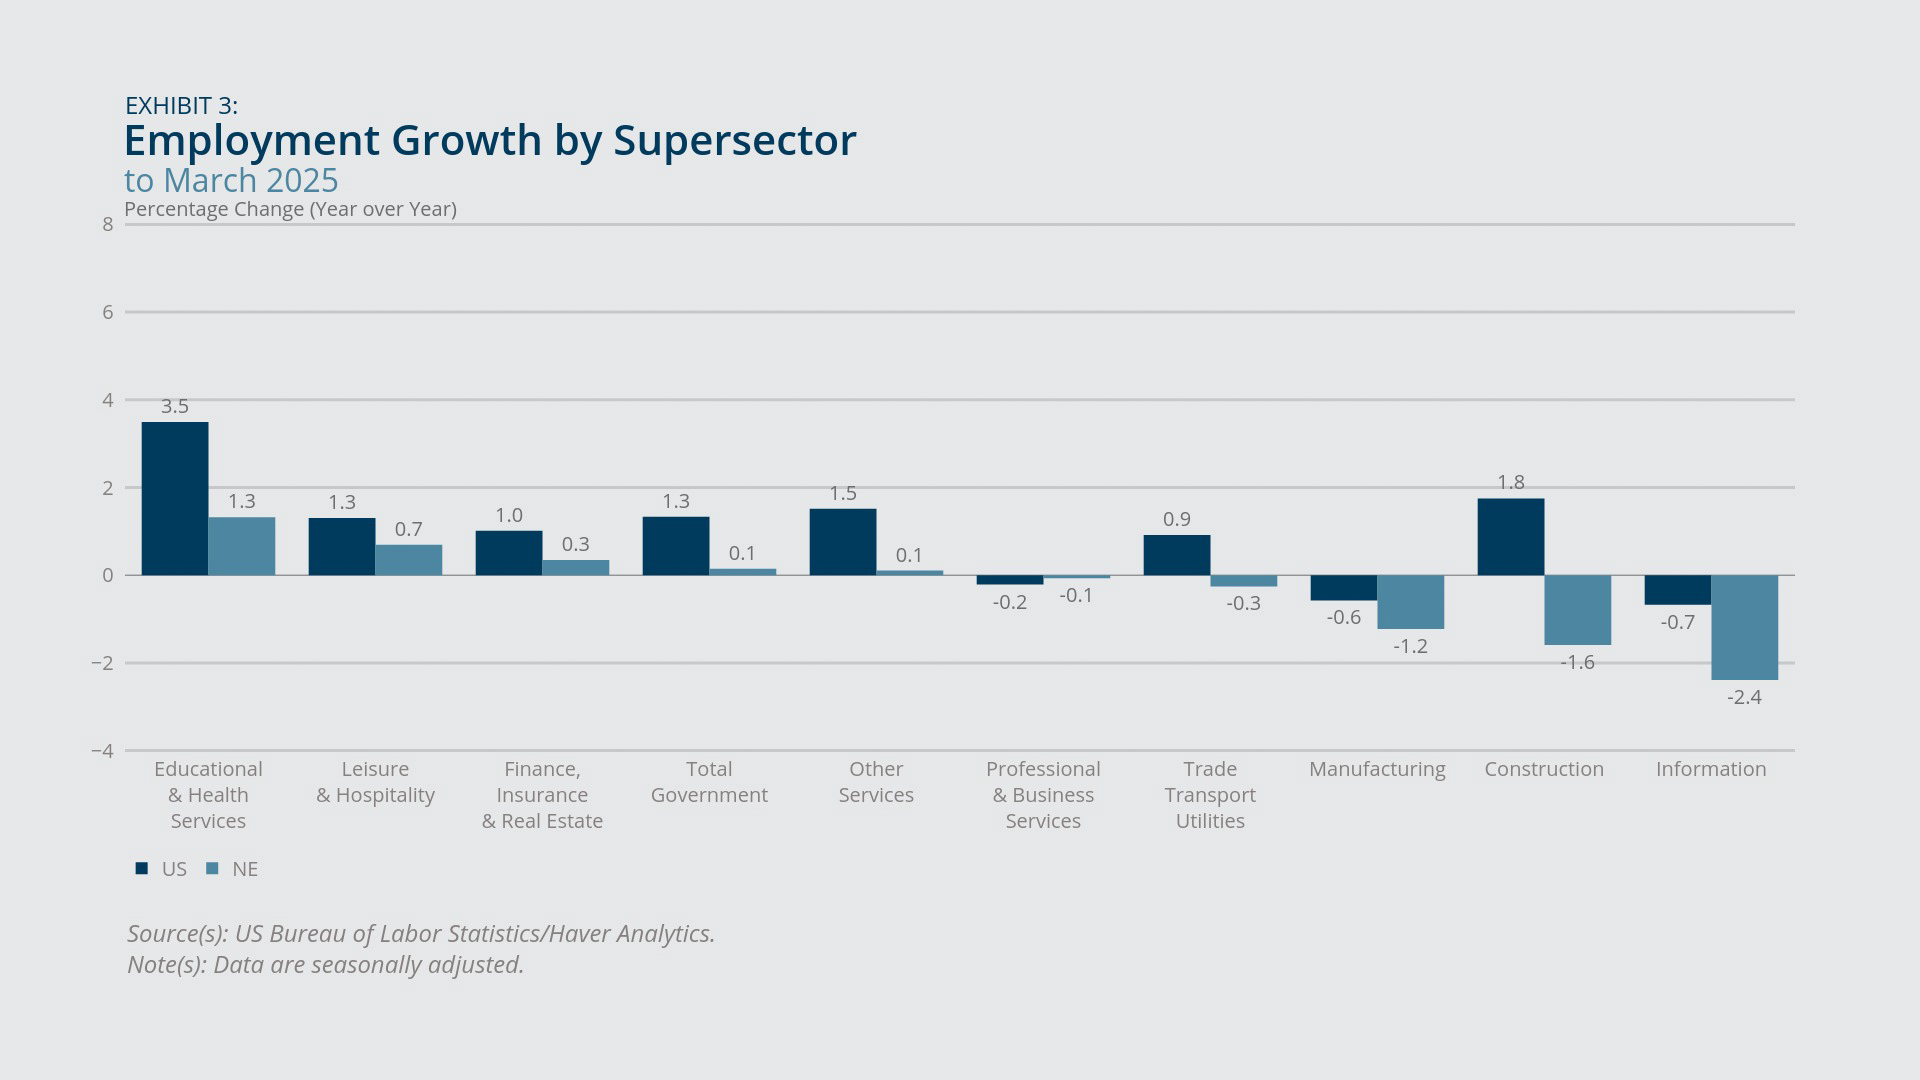
Employment growth in New England also differed across sectors. In terms of year-over-year job growth, educational and health services exhibited the largest increase in the region (1.3 percent) in March 2025, followed by leisure and hospitality (0.7 percent) and finance, insurance, and real estate (0.3 percent).2 By contrast, information, construction, and manufacturing displayed the most negative employment growth (year-over-year declines of 2.4 percent, 1.6 percent, and 1.2 percent, respectively) (Exhibit 3).

Federal Reserve Bank of Boston
Federal Reserve Bank of Boston
Federal Reserve Bank of Boston
Unemployment and Labor Force Participation
- The unemployment rate in New England was slightly below the US rate and experienced a year-over-year increase.
- Unemployment rates for every state in the region rose year-over-year, with the largest increases for Maine, New Hampshire, and Rhode Island.
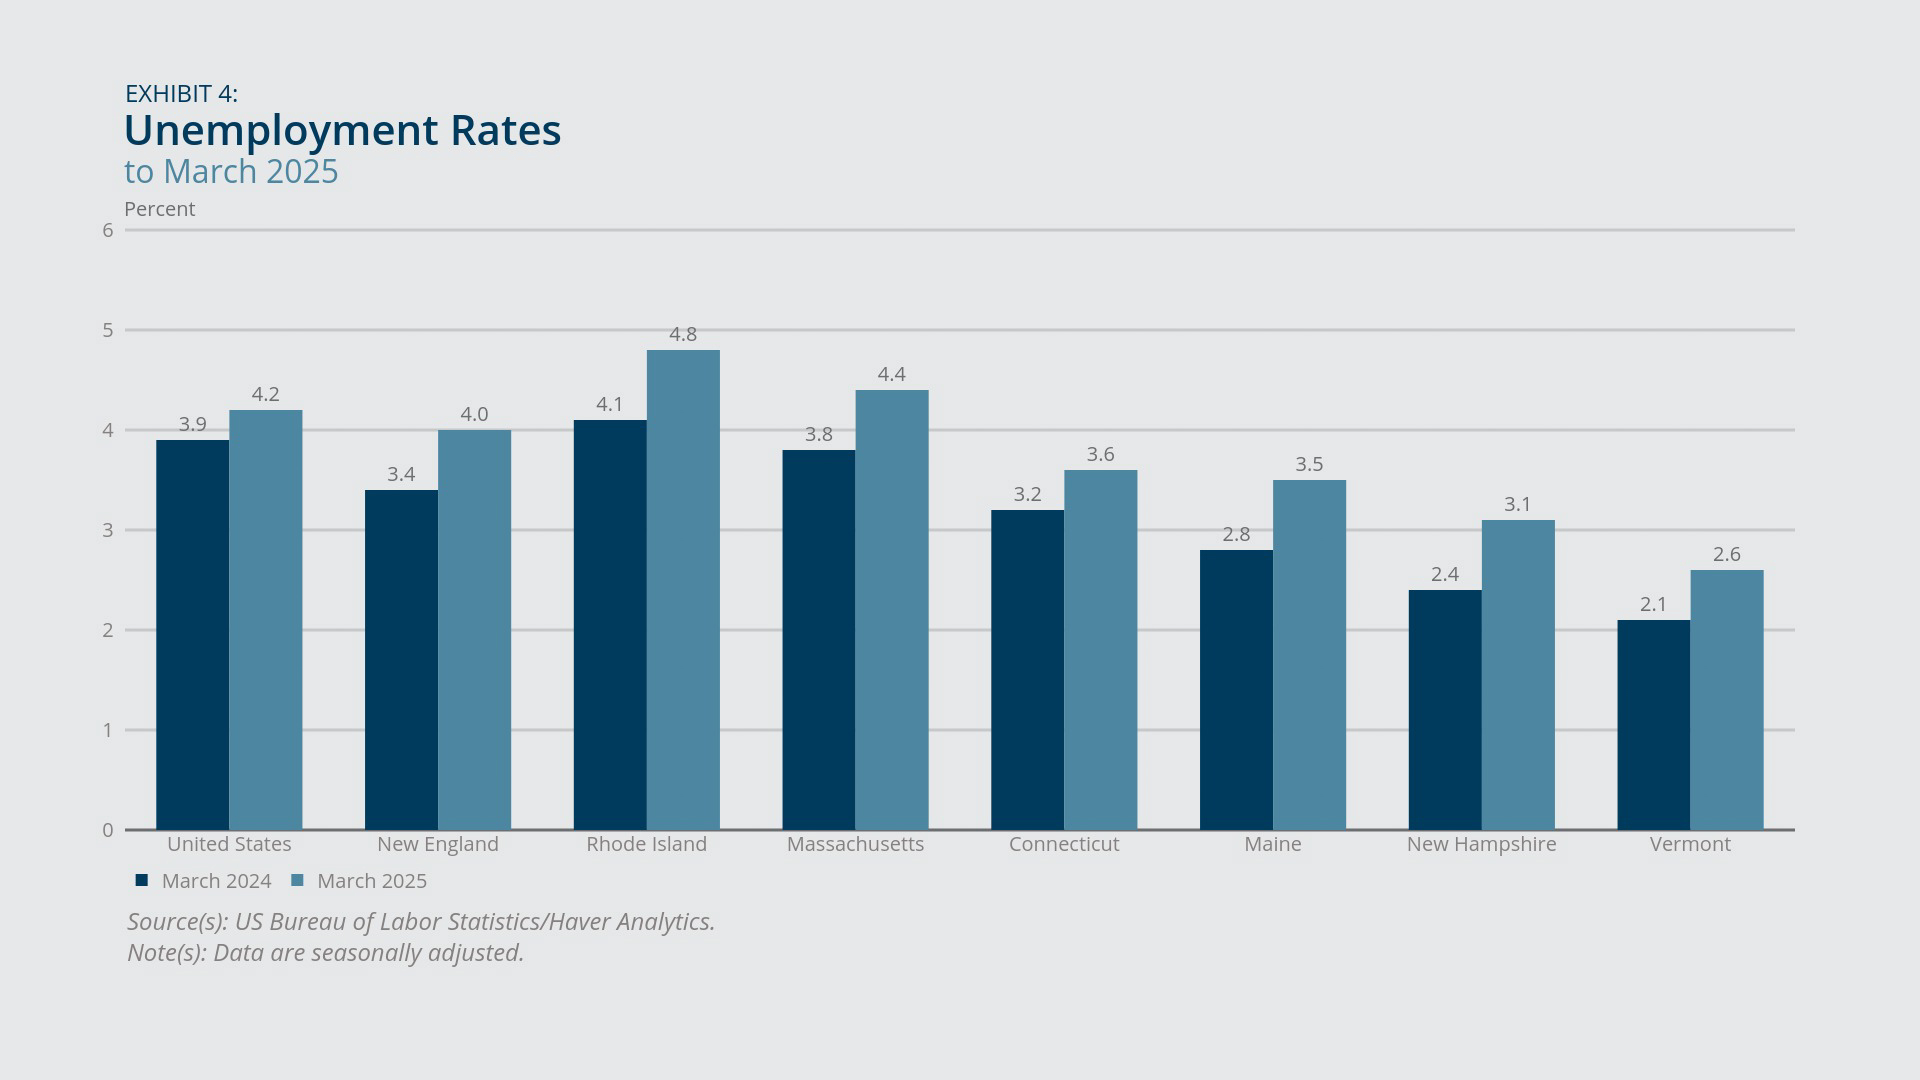
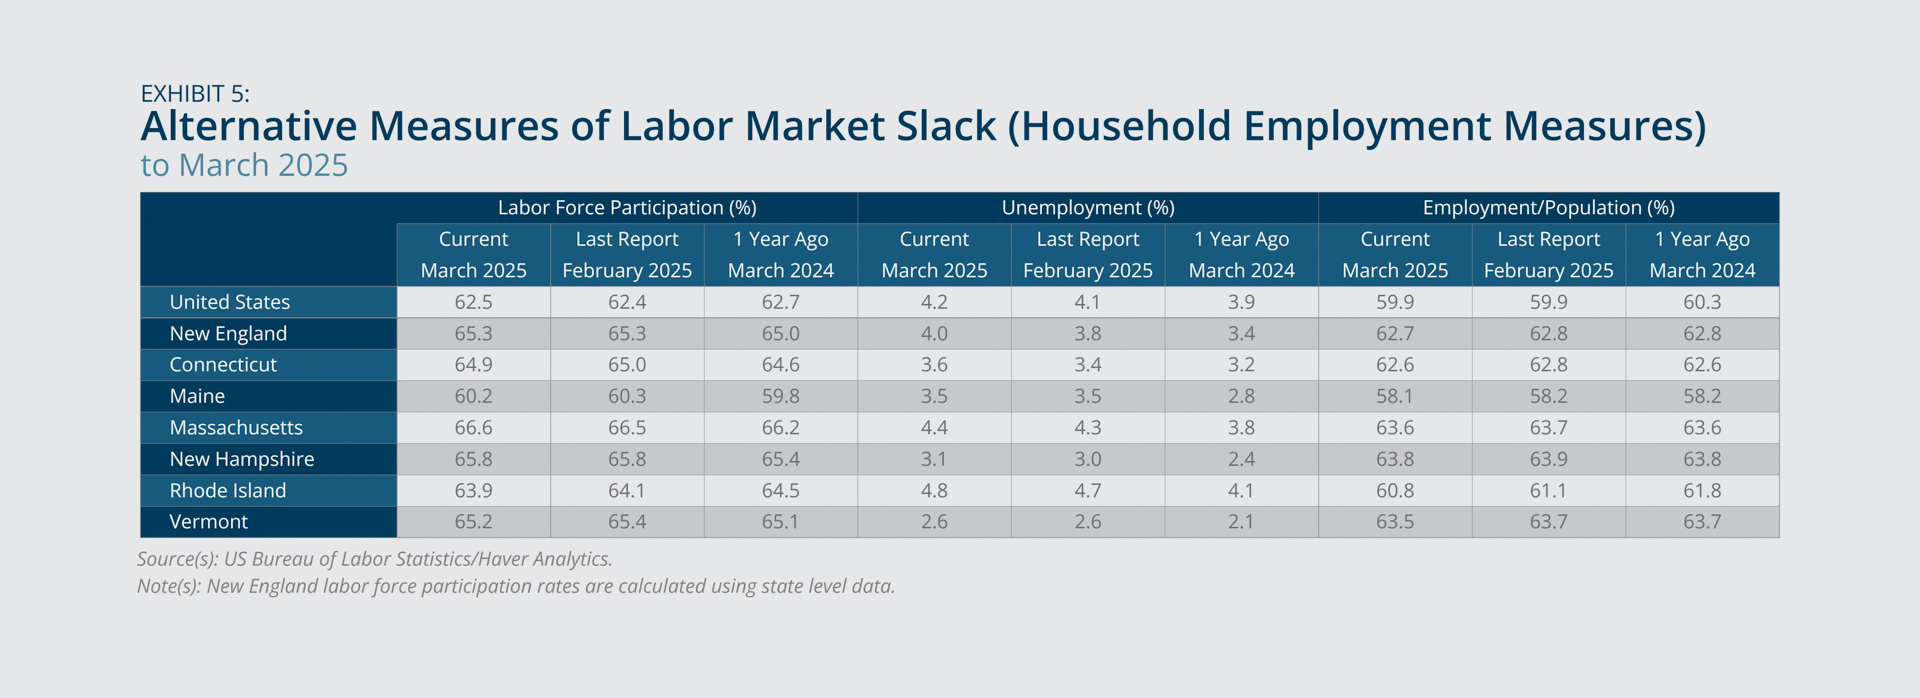
Unemployment in New England was 4.0 percent in March 2025 according to household surveys, reflecting a year-over-year increase of 0.6 percentage point. Regional unemployment was slightly below the corresponding national rate, which grew 0.3 percentage point year-over-year to 4.2 percent (Exhibit 4). Among the New England states, unemployment rates ranged from a low of 2.6 percent in Vermont to a high of 4.8 percent in Rhode Island. Every state in the region exhibited a year-over-year increase in the unemployment rate, with the largest increases for Maine, New Hampshire, and Rhode Island (each 0.7 percentage point).
Examining labor force participation rates (Exhibit 5) can help determine if they are a potential contributing factor to the observed changes in unemployment rates. In New England, the participation rate increased year-over-year by 0.3 percentage point in March 2025 to 65.3 percent, in contrast to the corresponding 0.2 percentage point fall in the national rate to 62.5 percent. Participation rates rose during this period for every state in the region except for Rhode Island, suggesting this mechanism likely helps explain some of the recent trends in unemployment rates.
Federal Reserve Bank of Boston
Federal Reserve Bank of Boston
Revisions to Labor Market Data
- Annual benchmark revisions to payroll employment data suggest diminished employment in New England recently compared with pre-revision estimates.
- In percentage terms, downward revisions to 2024 average monthly payroll employment in the region (–0.4 percent) were largest for Vermont (–0.9 percent), New Hampshire (–0.8 percent), and Massachusetts (–0.5 percent).
- Annual revisions to household employment and unemployment data led to a modest upward revision of the recent unemployment rate in New England compared with pre-revision estimates
On February 7, 2025, the Bureau of Labor Statistics (BLS) released its annual benchmark revision to the payroll employment data for the United States. The revision indicated that 589,000 fewer jobs were added in the nation over the 12-month period ending in March 2024. (The total is seasonally adjusted; if it were not seasonally adjusted, the total would be 598,000 fewer jobs).3 This downward revision is somewhat smaller than the preliminary estimate provided by the BLS on August 21, 2024, which indicated that 818,000 fewer jobs were added in the United States.4 The preliminary estimate suggested employers added roughly 174,000 jobs per month, on average, during the noted one-year period, reflecting a downward revision of 28 percent from the 242,000 jobs per month added, on average, according to pre-revision data. However, seasonally adjusted data indicate employers added approximately 196,000 jobs per month, on average, during the 12 months in question, reflecting a downward revision of 19 percent from the pre-revision data.
On March 17, 2025, the BLS also released its annual benchmark revision to the payroll employment data for all 50 states, the District of Columbia, and select metropolitan areas. This release, including a recalculation of seasonal adjustment factors, enables an assessment of the regional impact of the benchmark revisions on seasonally adjusted payroll employment data from January 2020 through December 2024.5 Focusing again on the 12-month period ending in March 2024: the revision indicates that roughly 2,100 more jobs were added in the region. This suggests New England employers added about 5,300 jobs per month from April 2023 through March 2024, on average, compared with pre-revision data that indicated roughly 5,100 jobs per month, on average, were added during that period, reflecting a slight upward revision of 3 percent.6
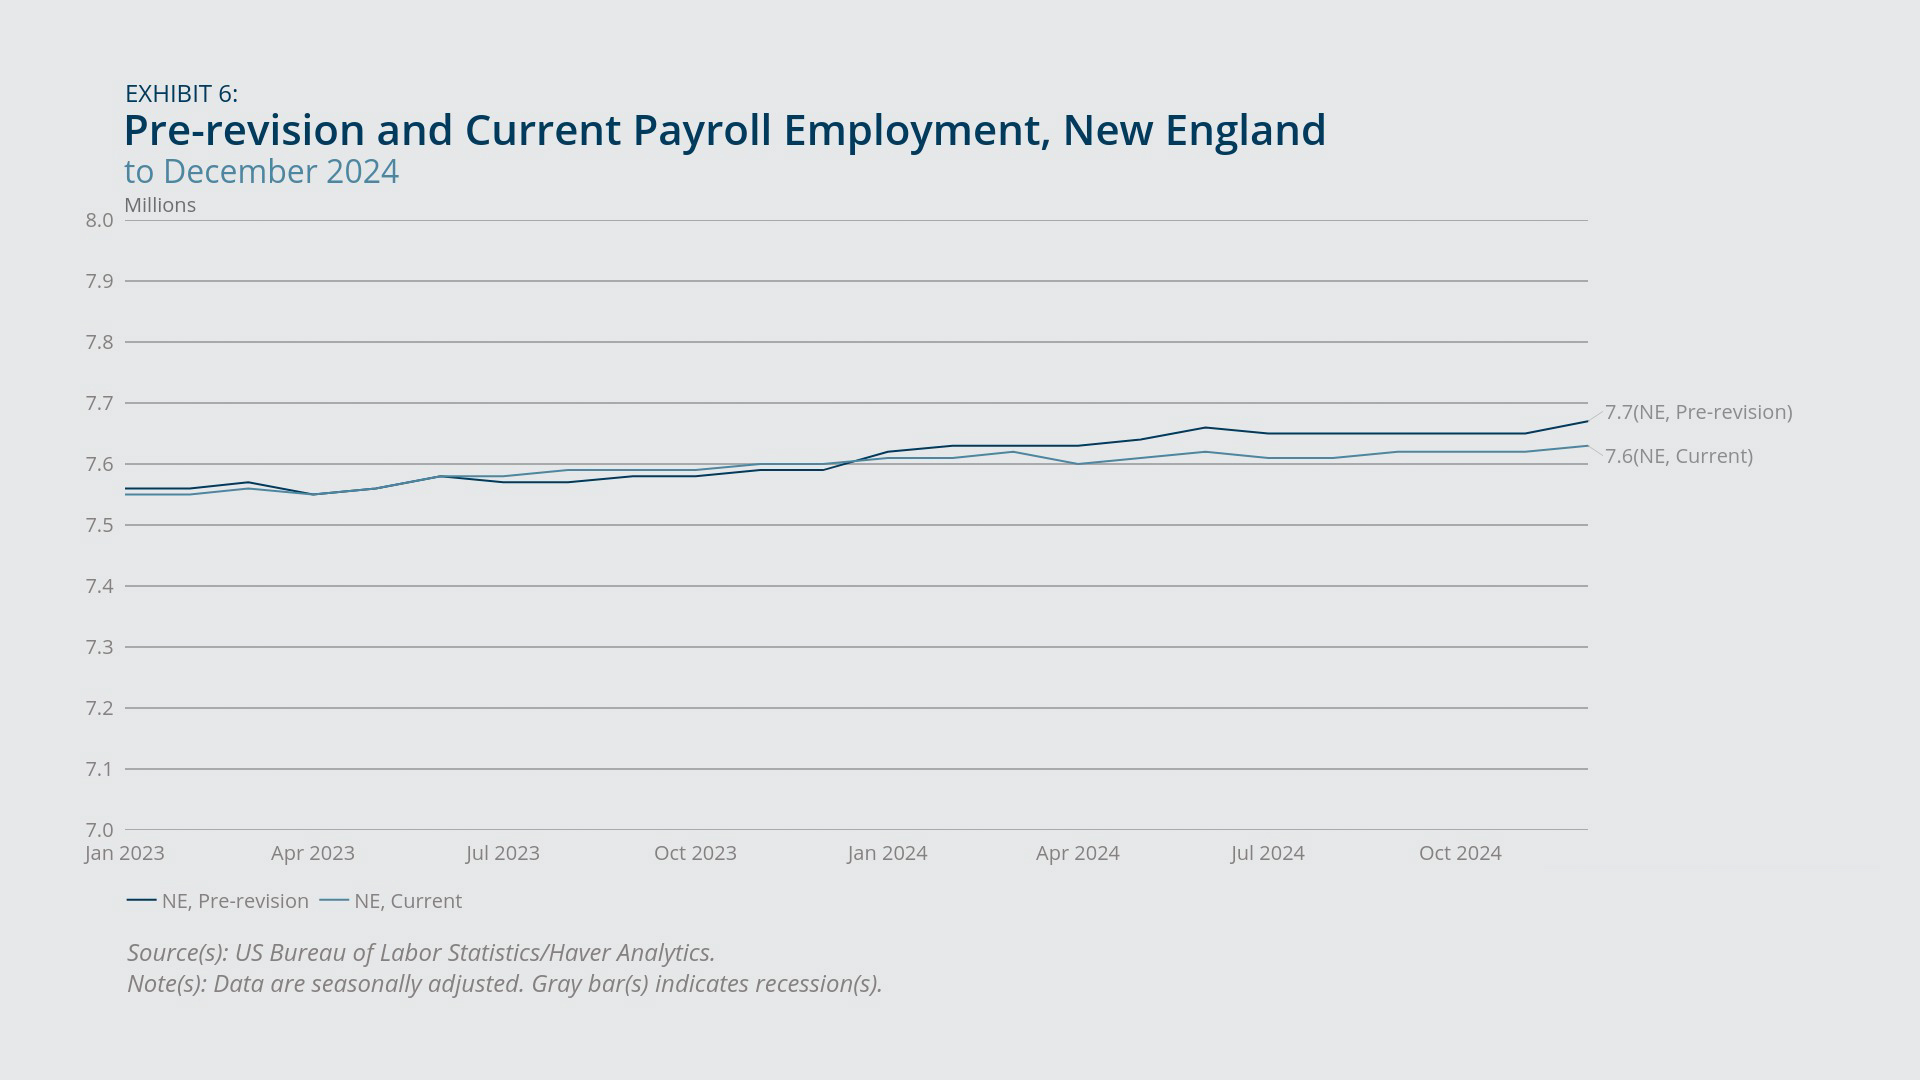
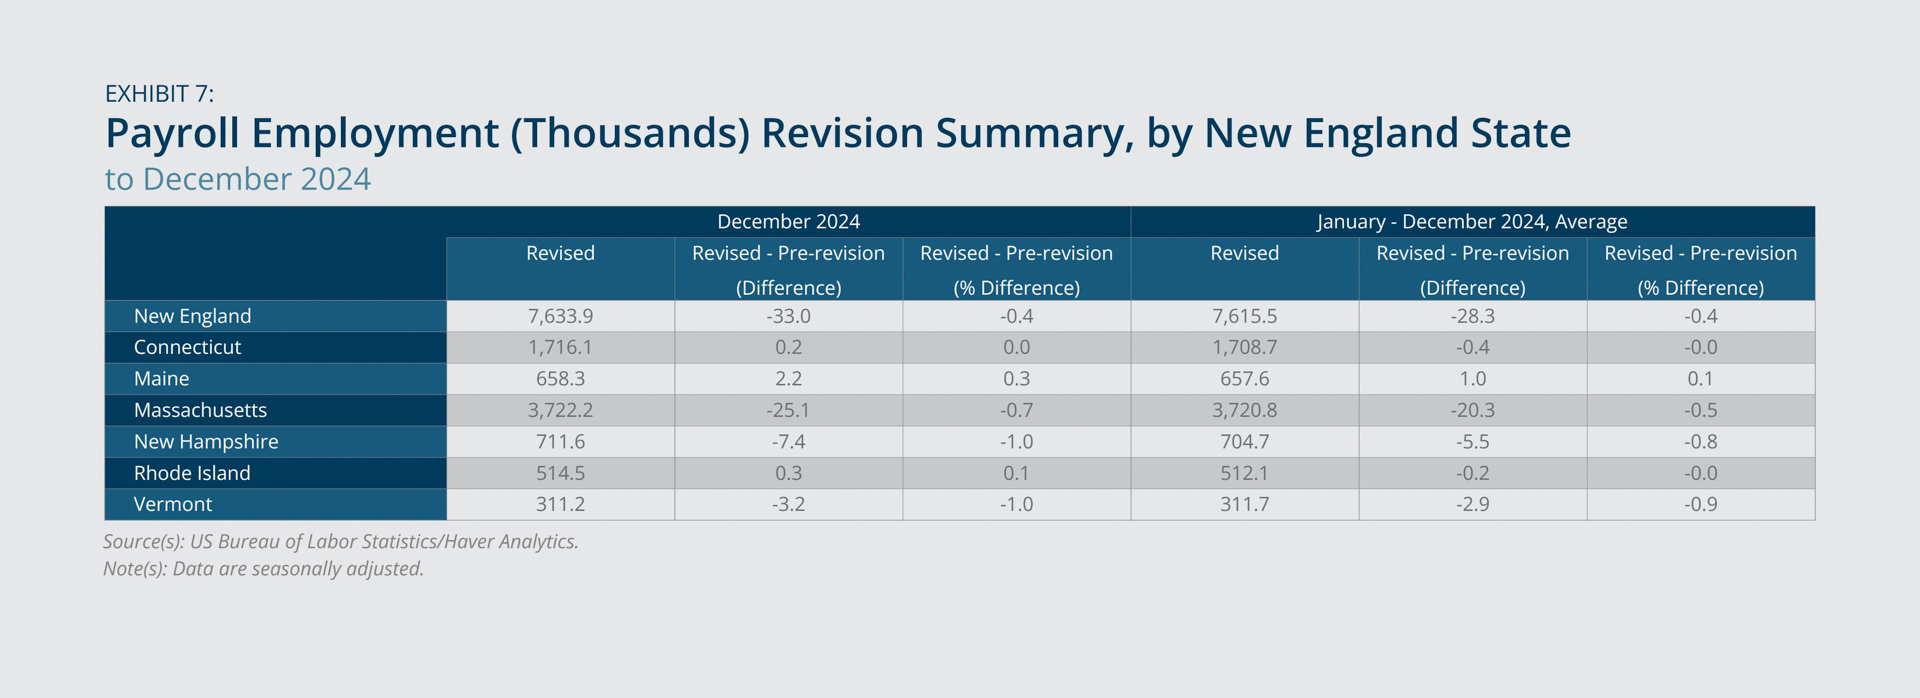
Focusing on 2024: the impact of the revisions can be assessed by comparing revised values with pre-revision values in December 2024, as well as by comparing revised values averaged from January 2024 through December 2024 with pre-revision values averaged over the same 12-month period. Such analysis indicates that payroll employment in New England was slightly lower in 2024 than initial estimates suggested (Exhibit 6).7 Revised numbers show that in December 2024 employment in the region was lower by 33,000 jobs compared with pre-revision numbers, and similarly, average monthly employment throughout 2024 was revised downward by 28,300 jobs (each reflecting a decline of 0.4 percent) (Exhibit 7). Among industries in the region (not shown), the largest such downward revisions, as a percentage of the initial estimate, occurred in the financial activities and manufacturing sectors (each –1.6 percent for December 2024 and –1.5 percent for the 2024 monthly average), as well as in construction (–1.6 percent for December 2024 and –1.0 percent for the 2024 monthly average). Among the New England states, Vermont (–1.0 percent for December 2024 and –0.9 percent for the 2024 monthly average), New Hampshire (–1.0 percent for December 2024 and –0.8 percent for the 2024 monthly average), and Massachusetts (–0.7 percent for December 2024 and –0.5 percent for the 2024 monthly average) exhibited the largest downward revisions, in percentage terms.
The March 17, 2025, BLS release of state employment and unemployment data for January 2025 also indicated revised estimates of regional labor market statistics that are derived primarily from household survey data.8 Focusing again on 2024: estimates of the unemployment rate in New England exhibited a modest upward revision (an increase of 0.1 percentage point for both December 2024 and the 2024 monthly average, equal to percentage changes of 2.8 percent and 3.6 percent, respectively) (Exhibit 8). For New England states, most revisions to unemployment rates in December 2024 were upward, except for Rhode Island (–0.1 percentage point, equal to –2.2 percent) and Massachusetts (no change). Revised December 2024 regional data were relatively unchanged for labor force participation rates (Exhibit 9) and employment-to-population ratios (not shown). For those indicators, absolute percentage differences between revised and pre-revised data are always less than 1.0 percent for New England as a whole and the New England states.
Federal Reserve Bank of Boston
Federal Reserve Bank of Boston
Federal Reserve Bank of Boston
Federal Reserve Bank of Boston
Inflation
- Inflation in New England was higher than inflation in the United States in March 2025.
- Year-over-year price growth exhibited a slowdown in the region compared with such growth in the previous month, with the shelter, transportation, and medical care expenditure categories contributing to the deceleration.
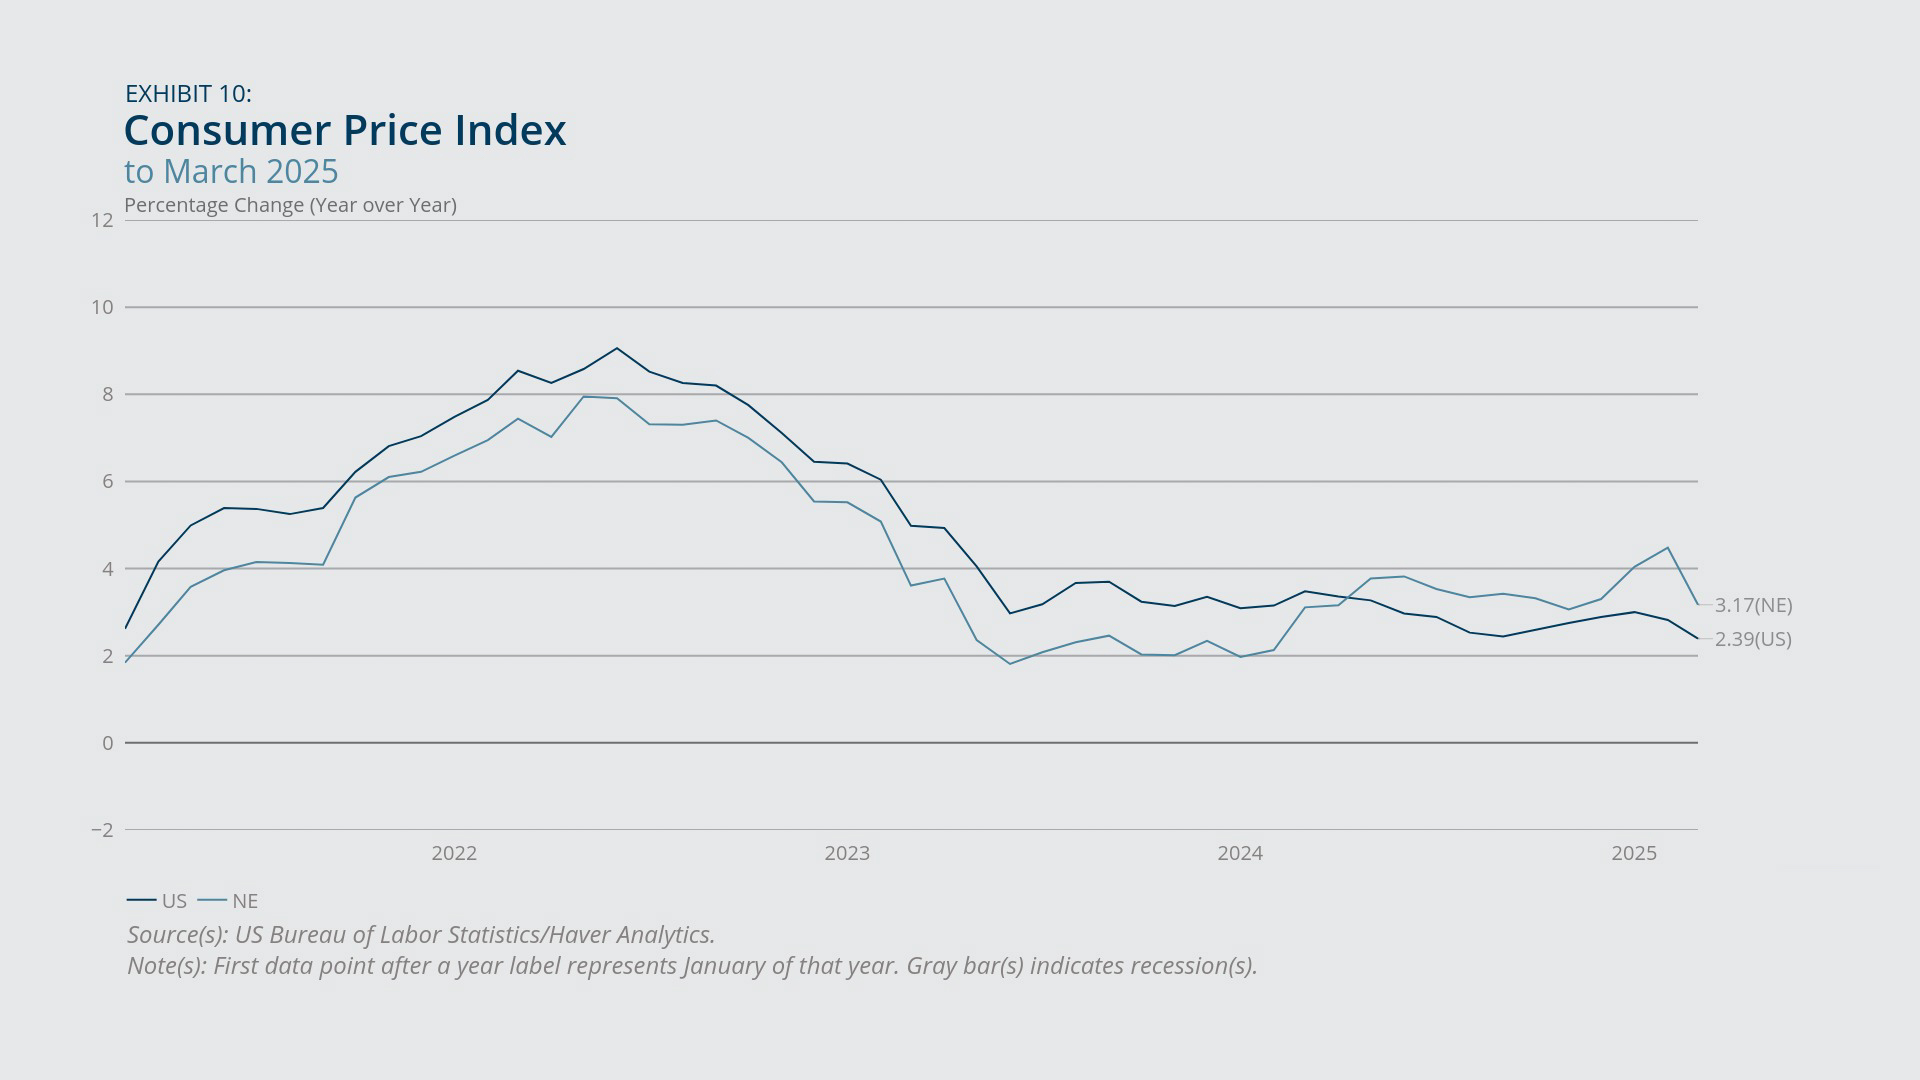
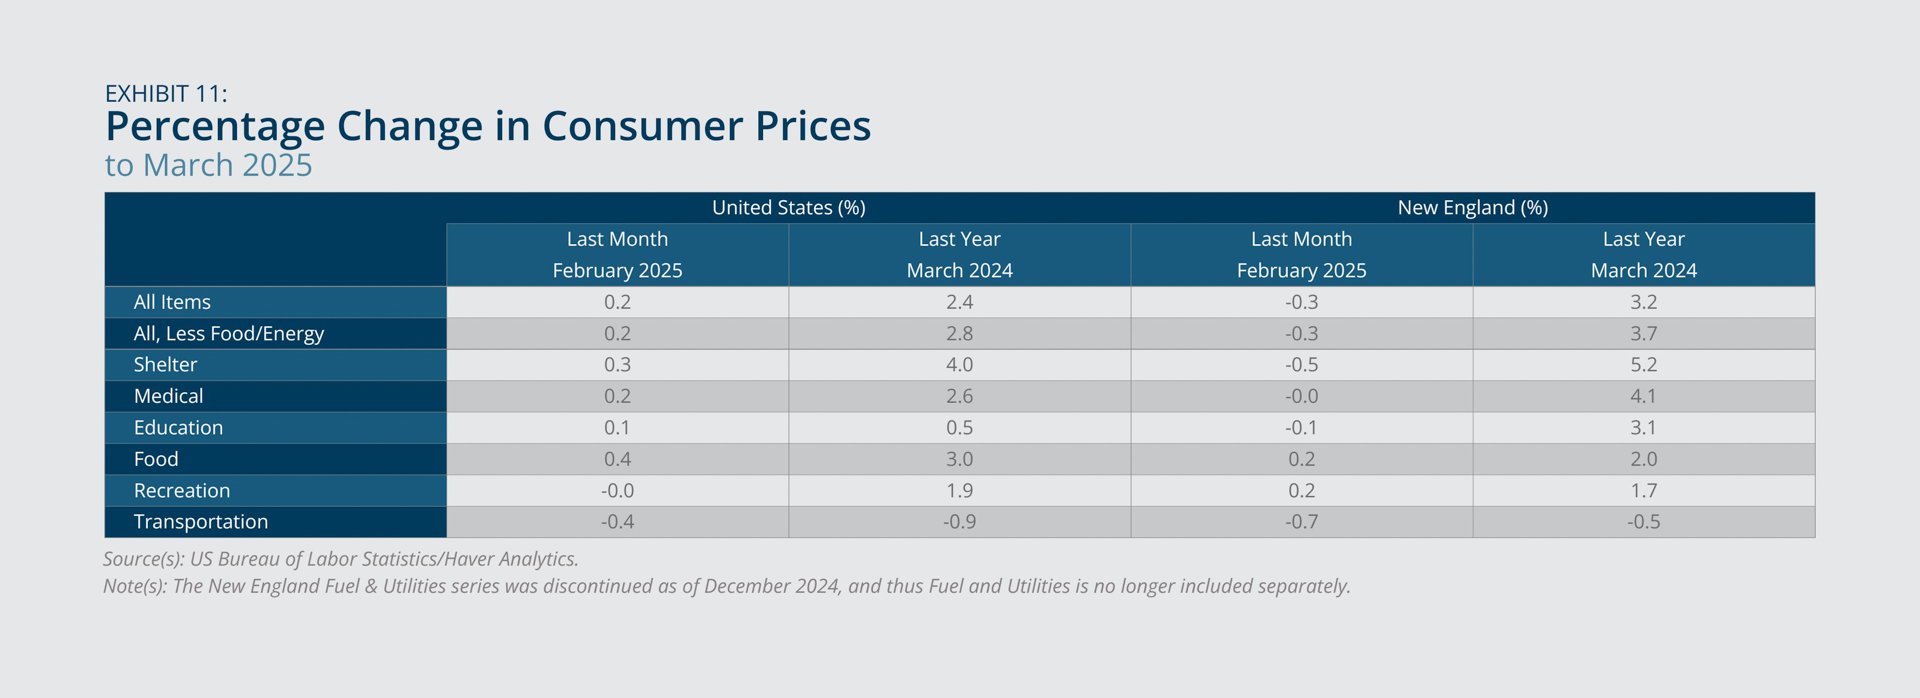
In March 2025, the Consumer Price Index for All Urban Consumers (CPI-U) exhibited year-over-year price growth of 3.2 percent for New England compared with a corresponding inflation rate of 2.4 percent in the United States (Exhibit 10). Both the region and nation experienced a slowdown in the rate of annual inflation relative to such price growth in the previous month. In the region, year-over-year price growth fell by 1.3 percentage points in March 2025 compared with annual growth in February 2025, while in the nation, year-over-year price growth fell by 0.4 percentage point during that period.
The shelter, medical care, and education and communication expenditure categories displayed the fastest annual price growth in the region. By contrast, transportation was the only expenditure category that exhibited a year-over-year decline, in both the region and nation (Exhibit 11). Core inflation (which excludes food and energy prices) in New England (3.7 percent) was higher than the overall inflation rate in the region. This occurrence partly reflects the noted rise in shelter prices (5.2 percent), which contributes relatively more to core inflation than overall inflation, and partly reflects growth in food prices (2.0 percent), which tempers overall inflation but does not affect core inflation. Declines in year-over-year price growth for medical care (slowed by 3.5 percentage points), transportation (slowed by 2.2 percentage points), shelter (slowed by 1.8 percentage points), and recreation (slowed by 0.7 percentage point) contributed to the deceleration in annual inflation observed in March 2025 compared with February 2025.
Federal Reserve Bank of Boston
Federal Reserve Bank of Boston
House Prices
- Annual house-price growth in New England exceeded corresponding growth in the United States, as it has since the first quarter of 2023.
- Three New England states ranked among the top five regarding fastest year-over-year house-price growth, with Connecticut ranked first.
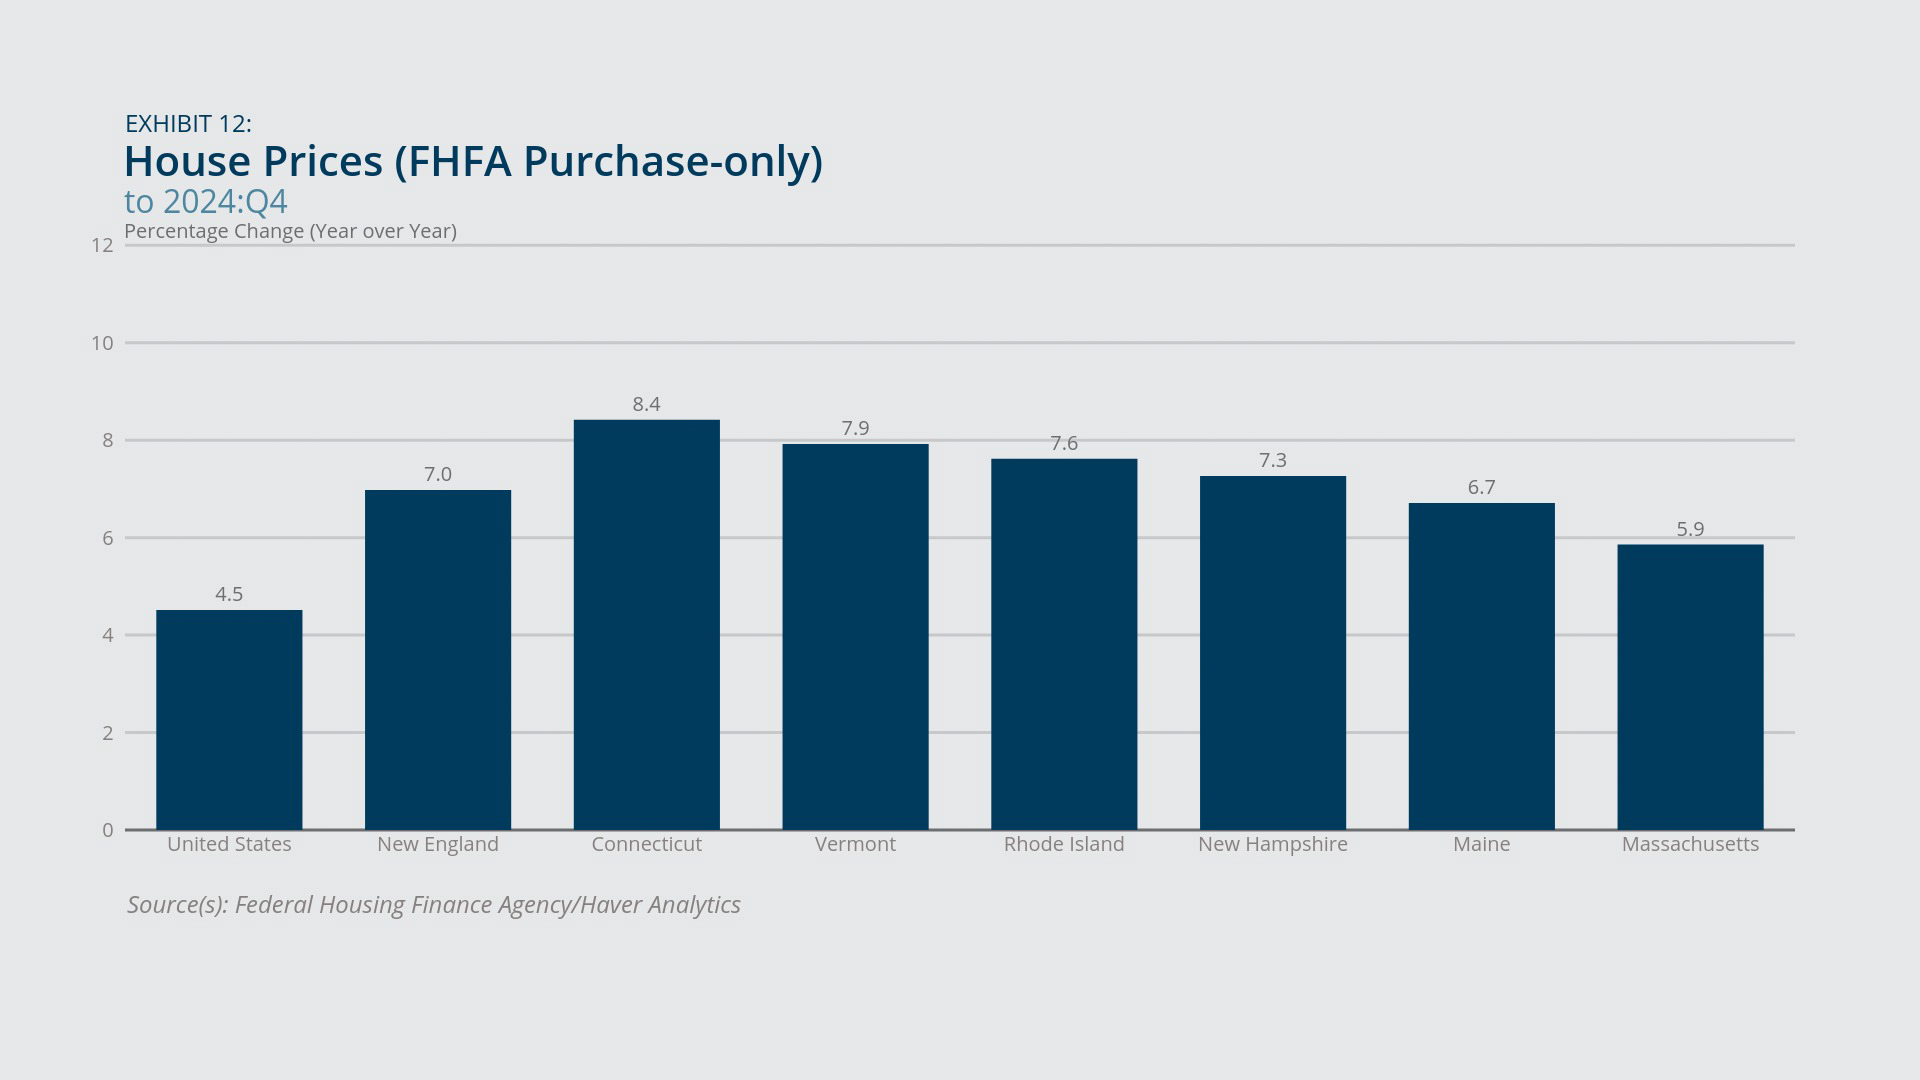
In the final quarter of 2024, the year-over-year growth in house prices (as measured by the Federal Housing Finance Agency House Price Index) in New England (7.0 percent) exceeded the concurrent national rate (4.5 percent) (Exhibit 12). Of the nine census divisions in the United States, New England experienced the fastest rate of year-over-year house-price growth. Such growth in the region has surpassed growth in the nation since the first quarter of 2023 (not shown).9 Additionally, three of the region’s states ranked among the nation’s top five regarding fastest year-over-year house-price growth: Connecticut (8.4 percent, ranked first), Vermont (7.9 percent, ranked fourth), and Rhode Island (7.6 percent, ranked fifth). Massachusetts saw the slowest house-price growth in the region (5.9 percent), but its rate was nevertheless higher than the national rate.
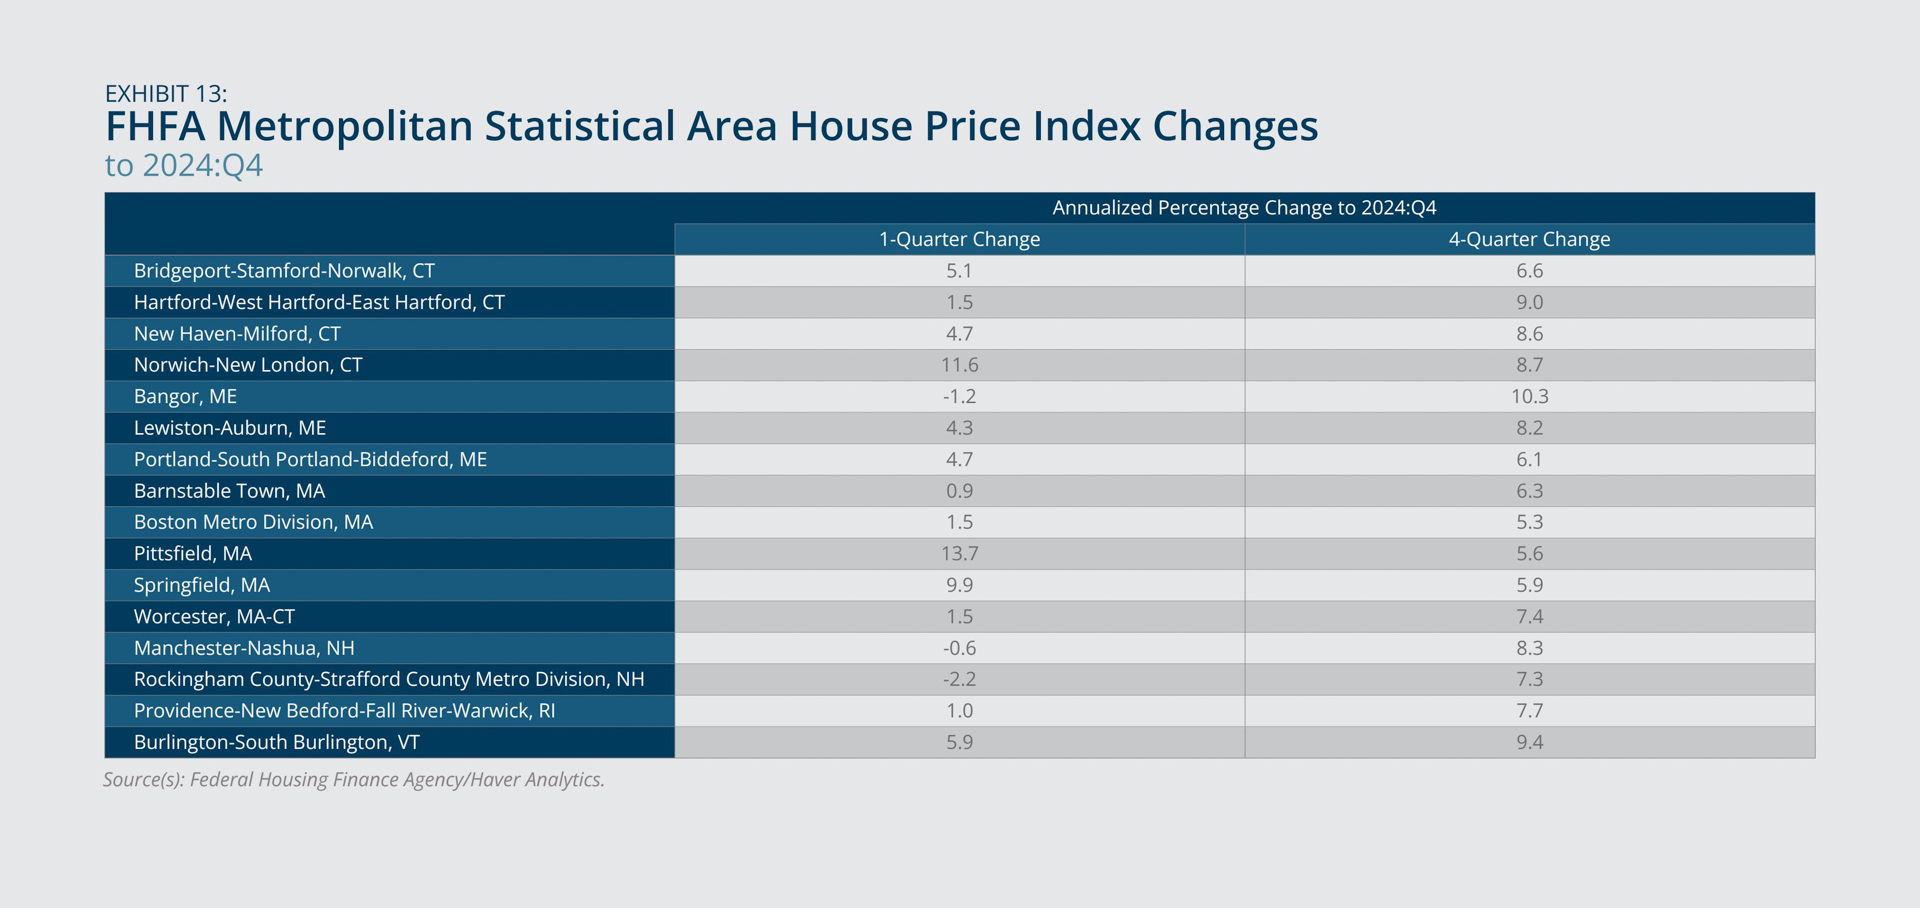
Among New England metropolitan areas, annual house-price growth ranged from 5.3 percent in the Boston metropolitan area of Massachusetts to 10.3 percent in the Bangor metropolitan area of Maine (Exhibit 13). Of the region’s states, Maine exhibited the largest range of year-over-year house-price growth among its metropolitan areas, with a low of 6.1 percent in Portland-South Portland-Biddeford and the aforementioned high in Bangor.
Federal Reserve Bank of Boston
Federal Reserve Bank of Boston
Consumer Confidence
- Consumers in both New England and the United States were less confident compared with a year earlier.
- Expectations about the future fell to a 12-year low in the region and nation.
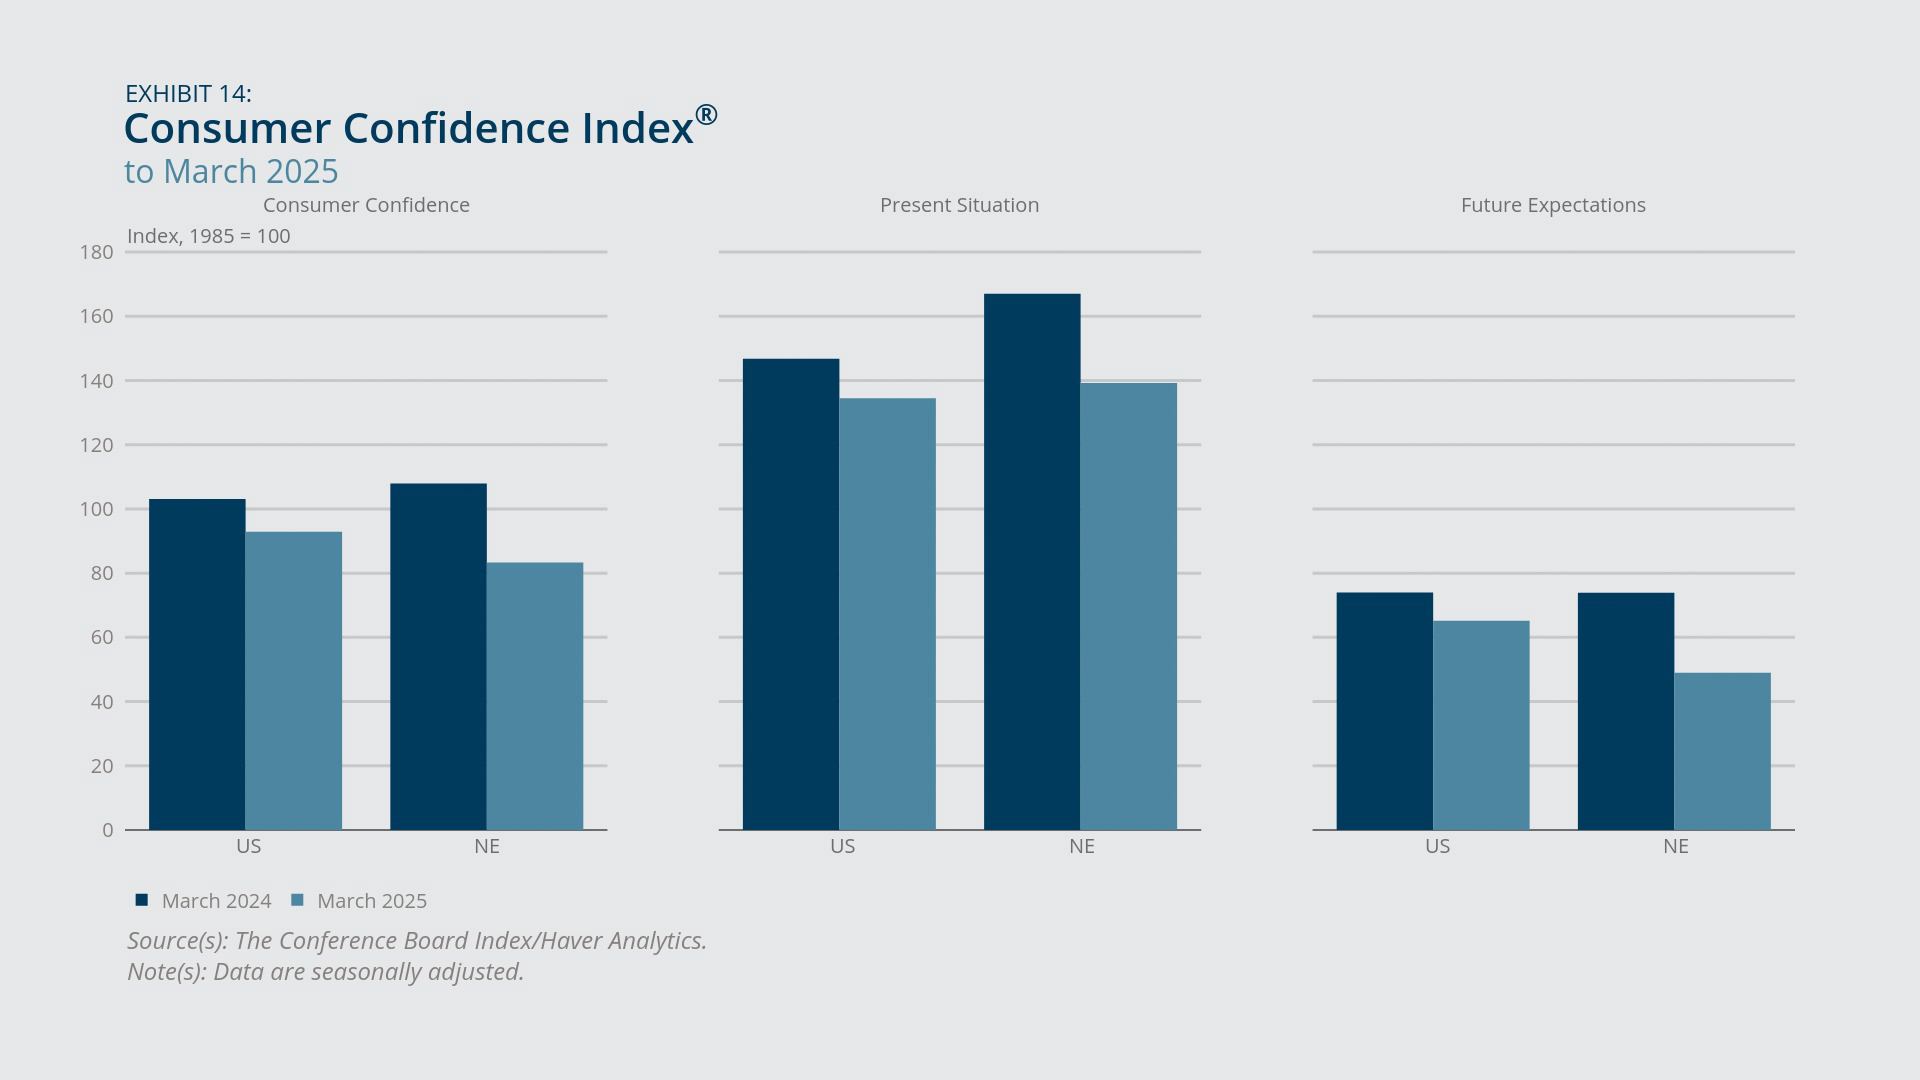
Consumer confidence, according to the Conference Board’s Consumer Confidence Index, was lower in March 2025 compared with one year earlier in both New England and the United States (Exhibit 14). This year-over-year decline in consumer sentiment was larger in the region than the nation. However, both regionally and nationally, the fall in consumer confidence reflected a less positive outlook on the present as well as diminished expectations for the future. The year-over-year decreases in both components were larger in New England than the United States. Additionally, consumers’ expectations for the future were at a 12-year low in March 2025, both nationally and regionally (Exhibit 15).10
Federal Reserve Bank of Boston
Federal Reserve Bank of Boston
Endnotes
- By contrast, since February 2020, employment-to-population ratios among New England states have fallen the most in New Hampshire and Maine (declines of 2.7 percentage points and 2.0 percentage points on February 2020 ratios of 66.5 percent and 60.1 percent, respectively). No state in the region experienced positive growth in its employment-to-population ratio relative to the pre-pandemic period or from March 2024 to March 2025.
- By further disaggregating regional data, we find that year-over-year employment growth in New England in March 2025 was positive for health care and social assistance (1.8 percent) but negative for educational services (–0.4 percent). We also find that total government employment exhibited slight year-over-year growth (0.1 percent), but this job growth was mixed among federal government (–0.9 percent), state government (0.9 percent), and local government (0.0 percent). The “freeze on the hiring of Federal civilian employees within the executive branch, as initially directed in the Presidential Memorandum of January 20, 2025 (Hiring Freeze)” was extended in April 2025 to remain in effect through July 15, 2025 (see “Extension of Hiring Freeze,” Presidential Memoranda, the White House, April 17, 2025).
- See “CES Benchmark Announcement” and “CES National Benchmark Article,” US Bureau of Labor Statistics (BLS), February 7, 2025. For the payroll survey (formally, Current Employment Statistics, or CES), the BLS notes that in “the prior 10 years, absolute benchmark revisions have averaged 0.1 percent, with a range from < 0.05 percent to 0.3 percent. Benchmark revisions are a standard part of the payroll survey estimation process. The benchmark adjustment represents a once-a-year re-anchoring, based on March data, of sample-based employment estimates to full population counts available through Unemployment Insurance (UI) tax records filed by nearly all employers with State Workforce Agencies.” For the 2024 US benchmark revisions, the BLS reports that both the seasonally adjusted estimate (589,000 fewer jobs added during the 12-month period ending March 2024) and the not seasonally adjusted estimate (598,000 fewer jobs added during the 12-month period ending March 2024) reflect a downward revision –0.4 percent.
- See “CES Preliminary Benchmark Announcement,” US Bureau of Labor Statistics, August 21, 2024, as discussed in the New York Times (see Ben Casselman, “U.S. Revises Job Figures, Exacerbating Labor Cracks,” New York Times, August 22, 2024) and several other news outlets.
- See “CES State and Area Benchmark Article,” US Bureau of Labor Statistics, March 17, 2025. The January 2020–December 2024 period is when the seasonally adjusted estimates are subject to change.
- Note that (5,300 jobs – 5,100 jobs) x 12 months = 2,400 jobs over a one-year period, which reflects an approximate 4 percent increase. This calculation differs from the stated 2,100 jobs and 3 percent increase. The difference is due to rounding, as the precise calculation is (5,250 jobs – 5,075 jobs) x 12 months = 2,100 jobs over a one-year period, which reflects an approximate 3 percent increase.
- As noted in the February 7, 2025, “CES National Benchmark Article,” for “the 9 months following the March benchmark (also called the post-benchmark period), BLS applies previously derived over-the-month sample changes to the revised March level to get the revised estimates. New net birth-death model forecasts are also calculated and applied during post-benchmark estimation.”
- See “Local Area Unemployment Statistics Estimation Methodology,” US Bureau of Labor Statistics, March 17, 2025. The household survey data (formally, Current Population Survey, or CPS) contribute to the BLS Local Area Unemployment Statistics (LAUS) program, along with payroll employment data and counts of unemployment insurance (UI) claims to “help mitigate volatility in the monthly state-level CPS estimates.” “At the beginning of each calendar year, the LAUS program revises up to five years of previous data to incorporate new inputs and population data. At the state level, LAUS receives new population controls from the US Census Bureau, as well as updated CES and UI claims inputs. State models then are re-estimated to incorporate these changes, using all data in the series. Revised statewide estimates are controlled to updated census division and national totals reflecting the new population controls.”
- This census division ranking reflects FHFA purchase-only house-price growth in the fourth quarter of 2024 that is not seasonally adjusted, as in Exhibit 12. According to corresponding data that are seasonally adjusted, New England experienced the second-fastest annual house-price growth among census divisions; the Middle Atlantic division ranks first. See “FHFA House Price Index (HPI) Quarterly Report – 2024Q4 & December 2024,” Federal Housing Finance Agency Index Report, February 25, 2025.
- See “US Consumer Confidence Tumbled Again in March,” Conference Board press release, March 25, 2025.

 About the Authors
Osborne Jackson,
Federal Reserve Bank of Boston
Osborne Jackson is a principal economist with the New England Public Policy Center in the Federal Reserve Bank of Boston Research Department.
Email: Osborne.Jackson@bos.frb.org
Annie Liu,
Federal Reserve Bank of Boston
Annie Liu is a senior research assistant with the New England Public Policy Center in the Federal Reserve Bank of Boston Research Department.
Kelly Jackson,
Federal Reserve Bank of Boston
Kelly Jackson is a senior data analyst in the Federal Reserve Bank of Boston Research Department.
Resources
Keywords
- Regional economy ,
- Economic Conditions ,
- New England ,
- NEPPC