New England Economic Conditions through July 10, 2025 


Key Takeaways
- New England’s nonfarm payroll employment in May 2025 was only 0.3 percent higher than a year prior. Connecticut, Maine, and Massachusetts saw little or no increase in jobs over that one-year period.
- New England’s unemployment rate for May 2025 rose to 4.2 percent, the same level as the US rate for that month. The region’s year-over-year rise in unemployment was larger than the increase in the US rate. Massachusetts had the region’s largest increase.
- For the first quarter of 2025, year-over-year personal income growth was slower in New England than across the country. Among the New England states, Massachusetts experienced the smallest gain.
- New England has continued to see a decrease in overall inflation since February 2025, but its inflation rate of 2.8 percent remained higher than the US rate of 2.4 percent in May 2025.
Sign up for new research and data on the New England economy.
Payroll Employment
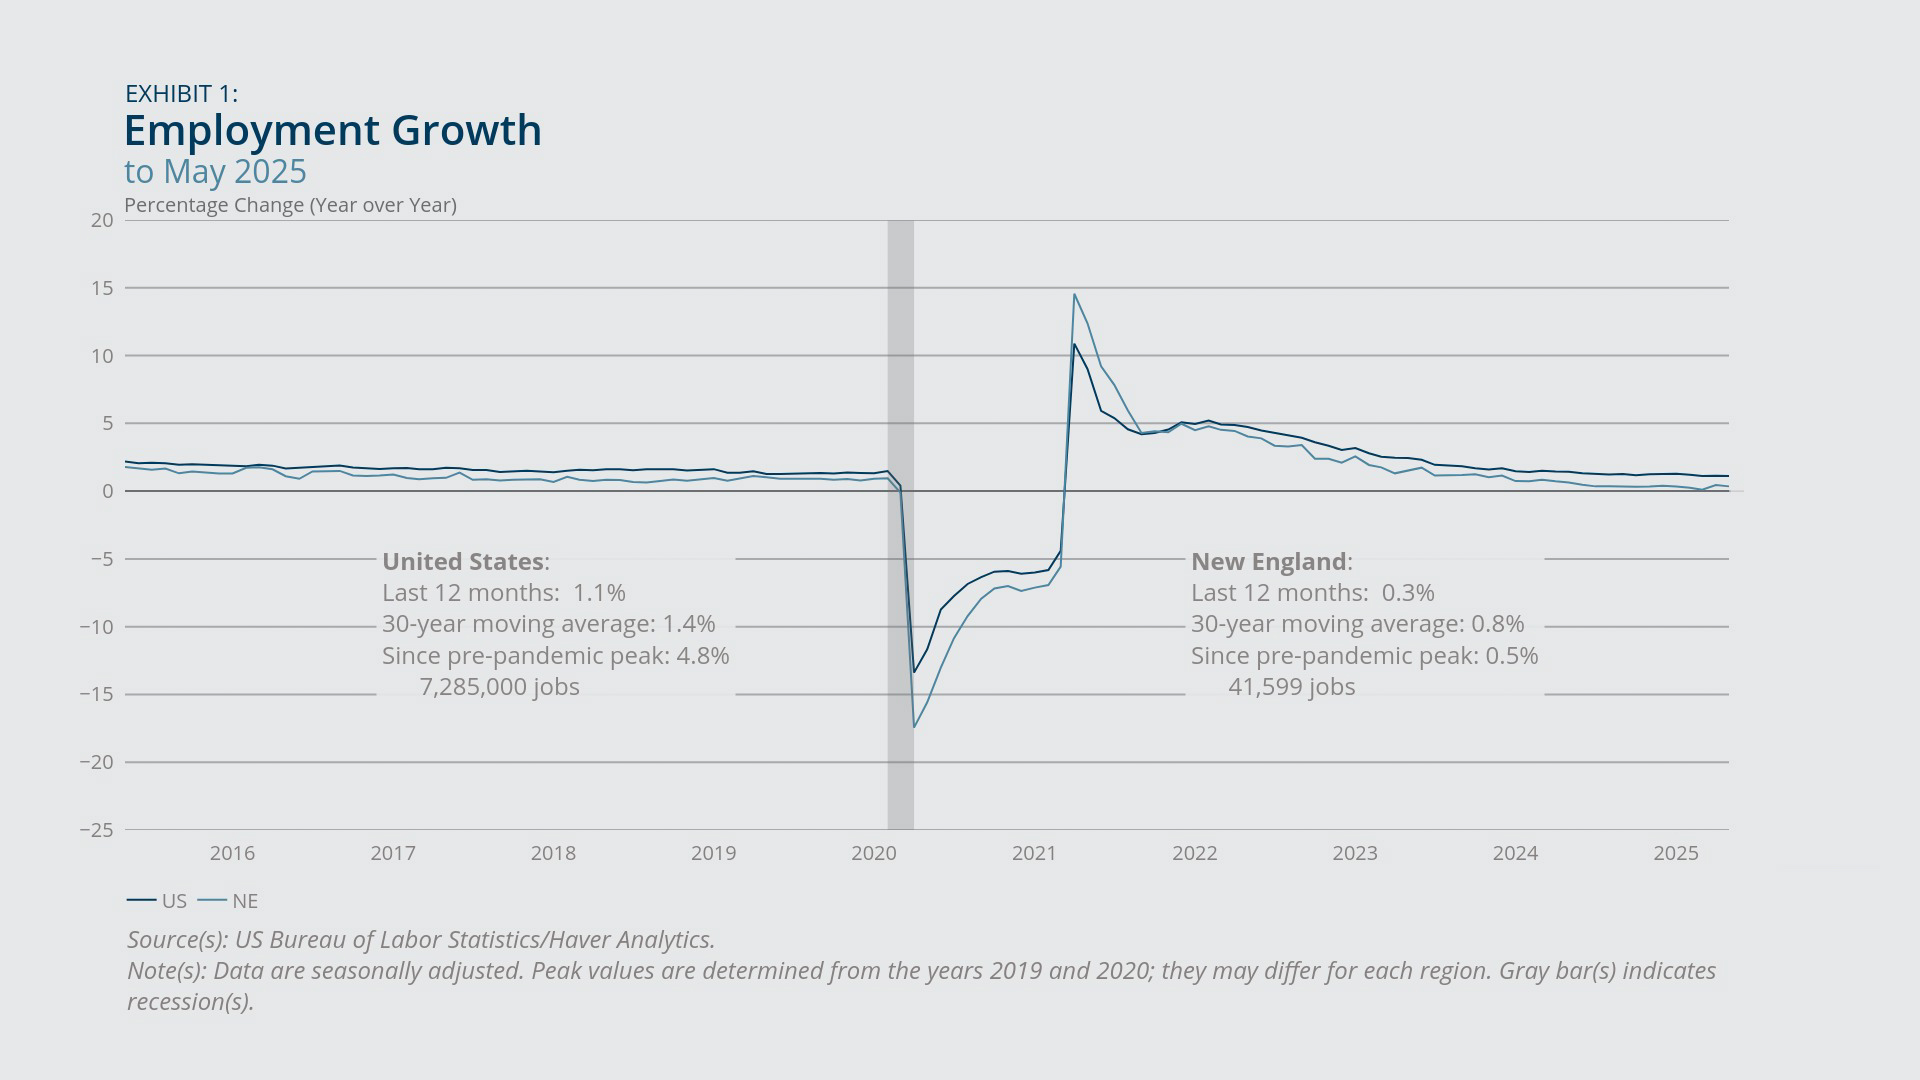
- New England’s payroll employment in May 2025 was only 0.3 percent higher than a year prior. Maine, Massachusetts, and Connecticut had little or no job growth over that one-year period.
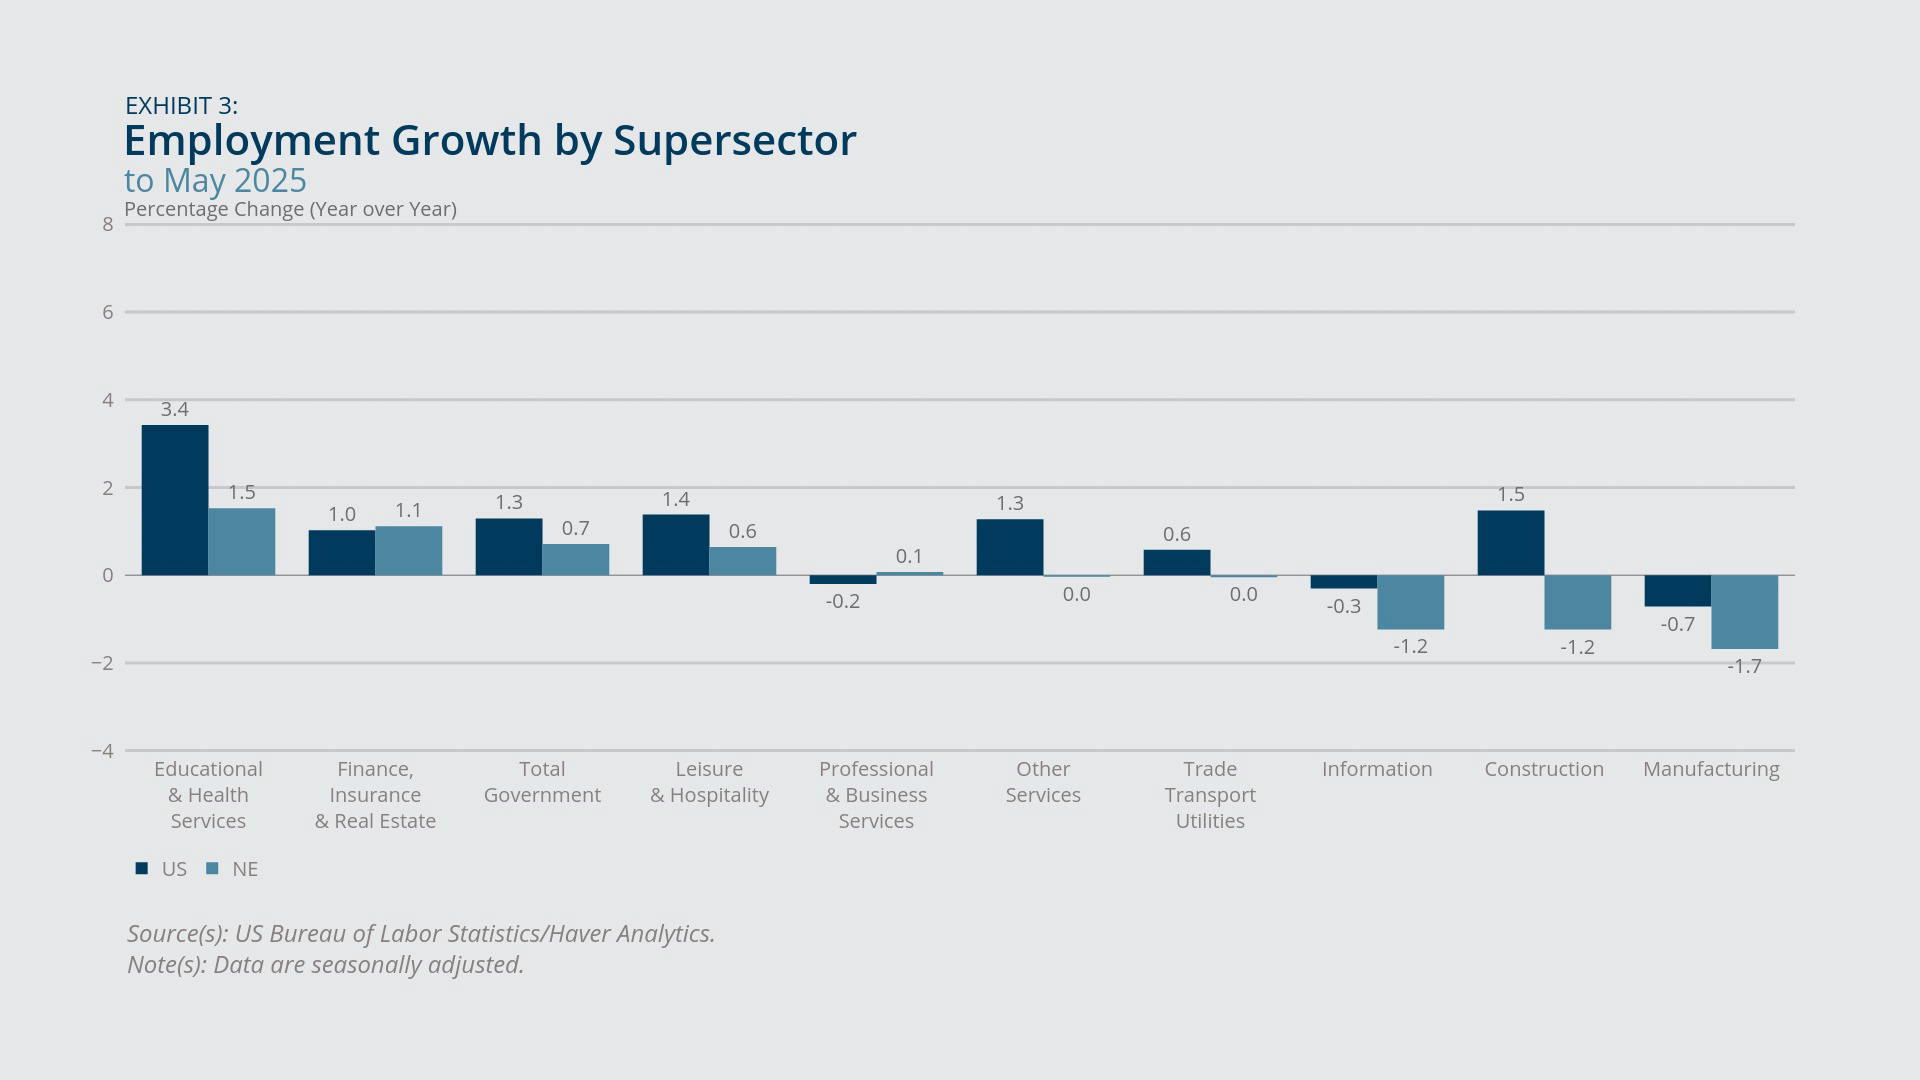
- The educational- and health-services sector grew faster than other supersectors in New England from May 2024 to May 2025, while the manufacturing sector experienced greater job loss than other supersectors.
- Compared with the United States, New England underperformed in year-over-year job growth in all supersectors except the finance, insurance and real estate sector and the professional- and business-services sector.
Year-over-year employment growth for New England reached 0.3 percent for May 2025 (Exhibit 1). It was lower than both the region’s 30-year moving average rate of 0.8 percent and the US rate of 1.1 percent for the same month.1 Since it topped 5.0 percent in December 2021, employment growth in the region has been trending gradually downward.
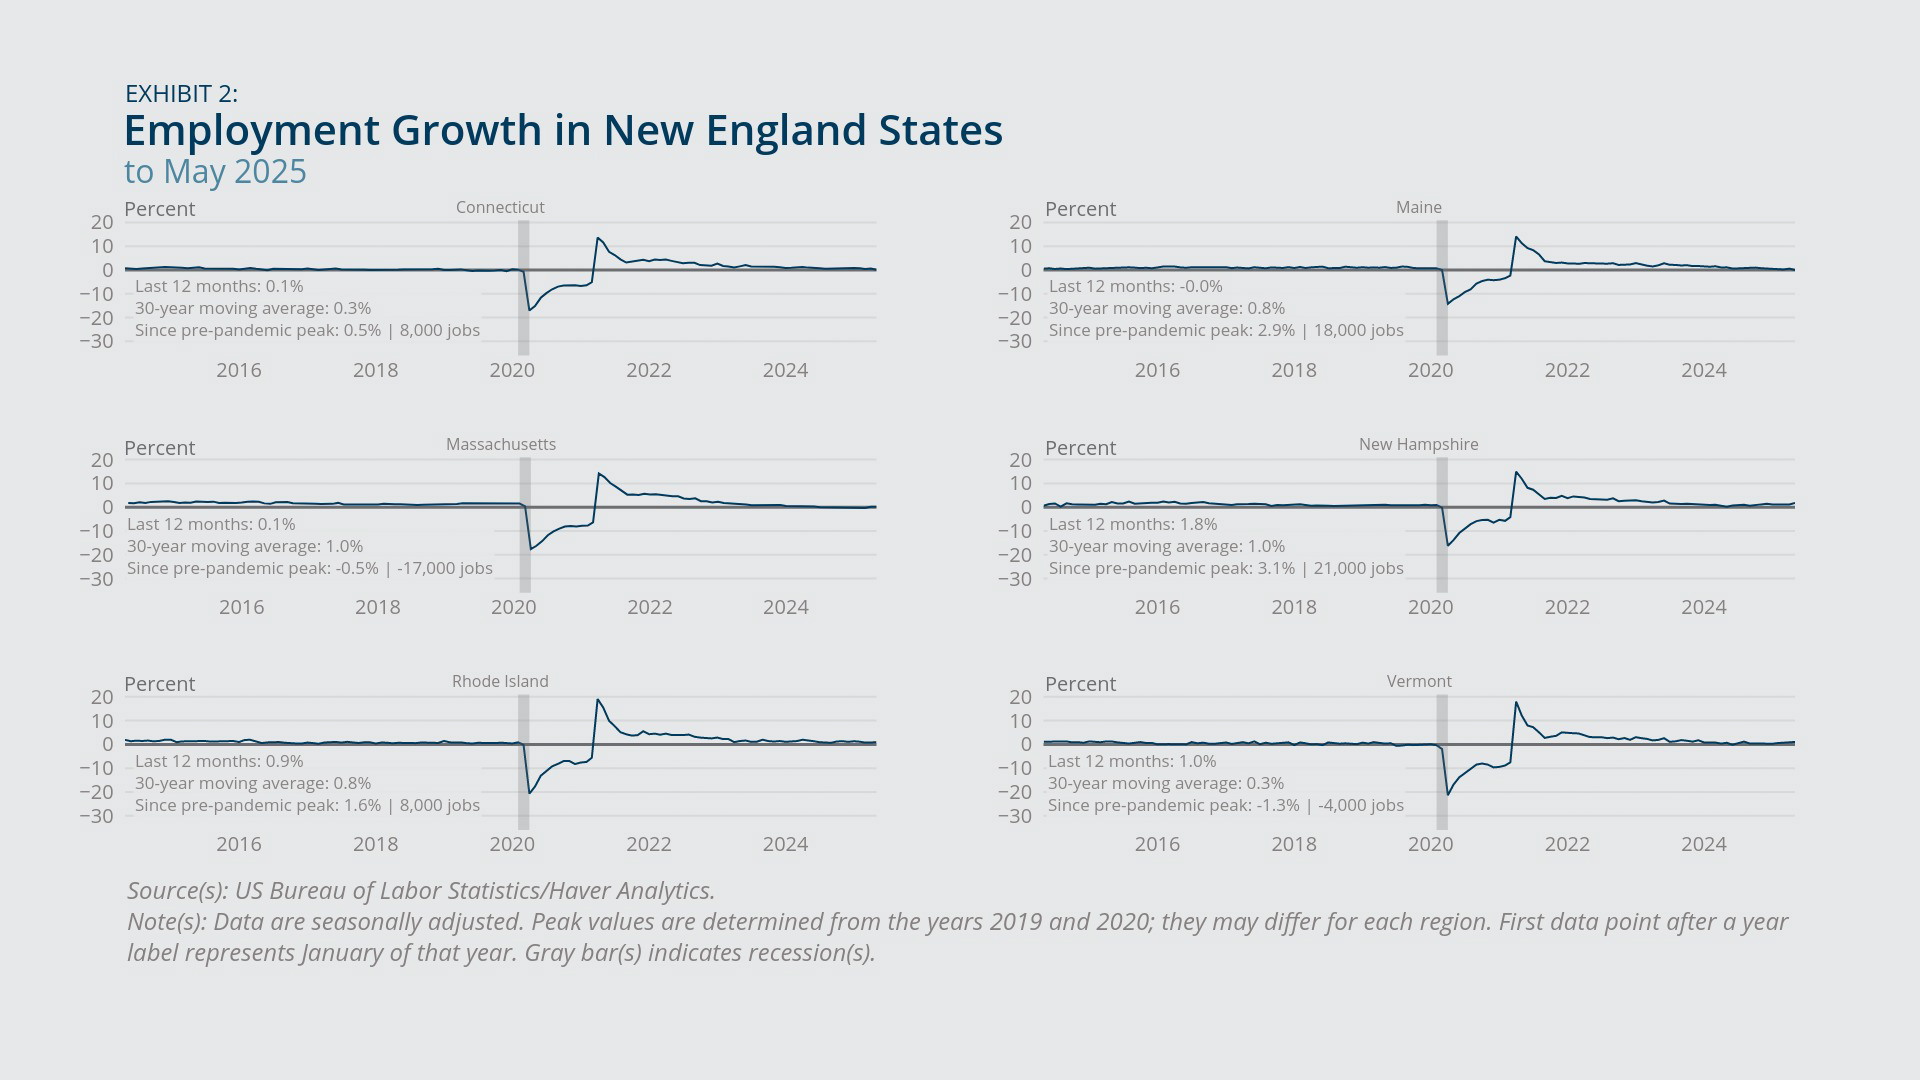
New England states diverged in the rate of job growth. Maine, Massachusetts, and Connecticut had little or no increase in nonfarm payroll employment for May 2025 compared with a year prior (Exhibit 2). By contrast, Rhode Island and Vermont’s employment grew about 1 percent year-over-year, while New Hampshire’s employment increased 1.8 percent.
Educational and health services led all supersectors both in New England and across the United States in employment growth from May 2024 to May 2025 (Exhibit 3). It saw an increase of 1.5 percent in the region and 3.4 percent nationally.2 By contrast, the manufacturing sector experienced greater job loss than other supersectors over that period both in New England and across the United States. It lost 1.7 percent and 0.7 percent of its job positions for the region and the country, respectively. In addition, New England lagged the United States in year-over-year job growth in all but two supersectors: professional and business services and finance, insurance and real estate.

Federal Reserve Bank of Boston
Federal Reserve Bank of Boston
Federal Reserve Bank of Boston
Household Employment
- New England experienced a year-over-year increase in the unemployment rate for May 2025 that was larger than the increase in the US rate. Among the New England states, Massachusetts had the largest increase.
- The region saw a decrease in its employment-to-population ratio over the 12-month period ending in May 2025.
- The labor force participation rate for New England rose slightly from a year prior. The increase was driven mostly by a relatively large rise in Massachusetts.
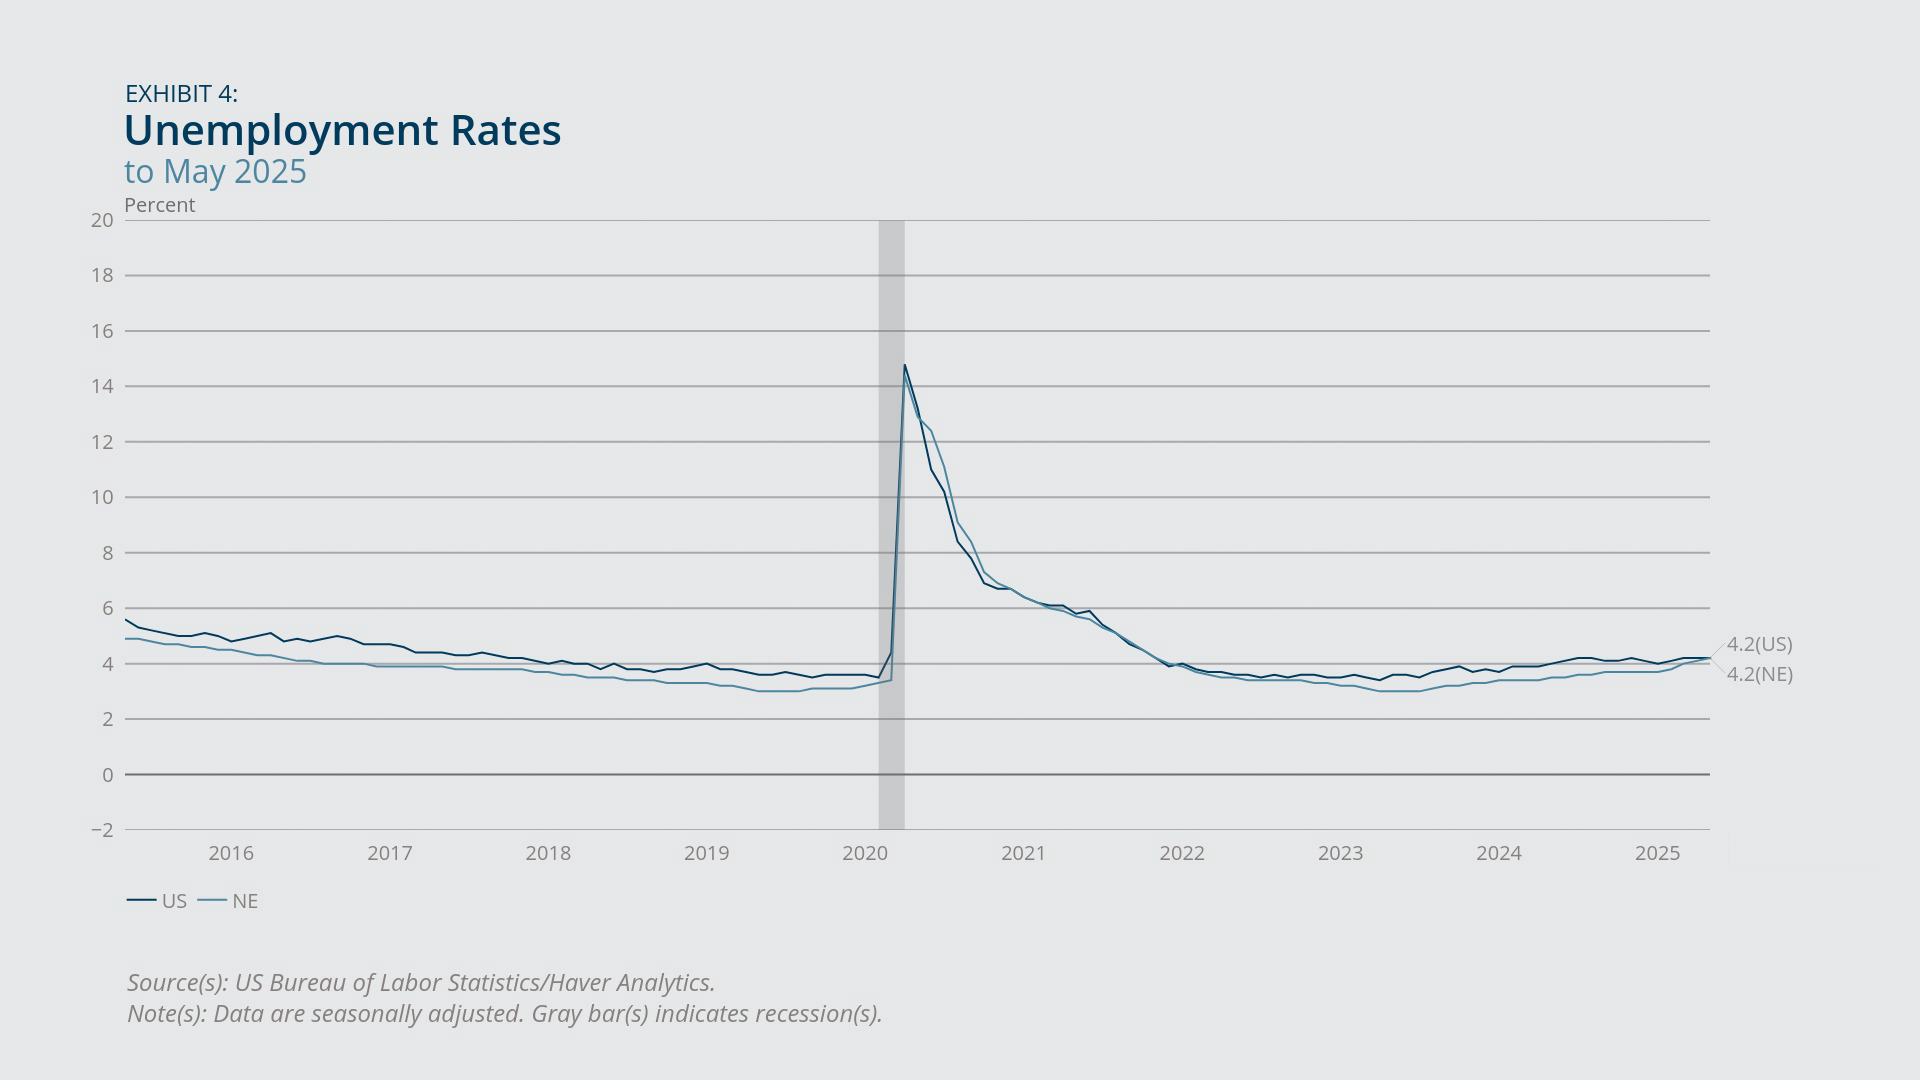
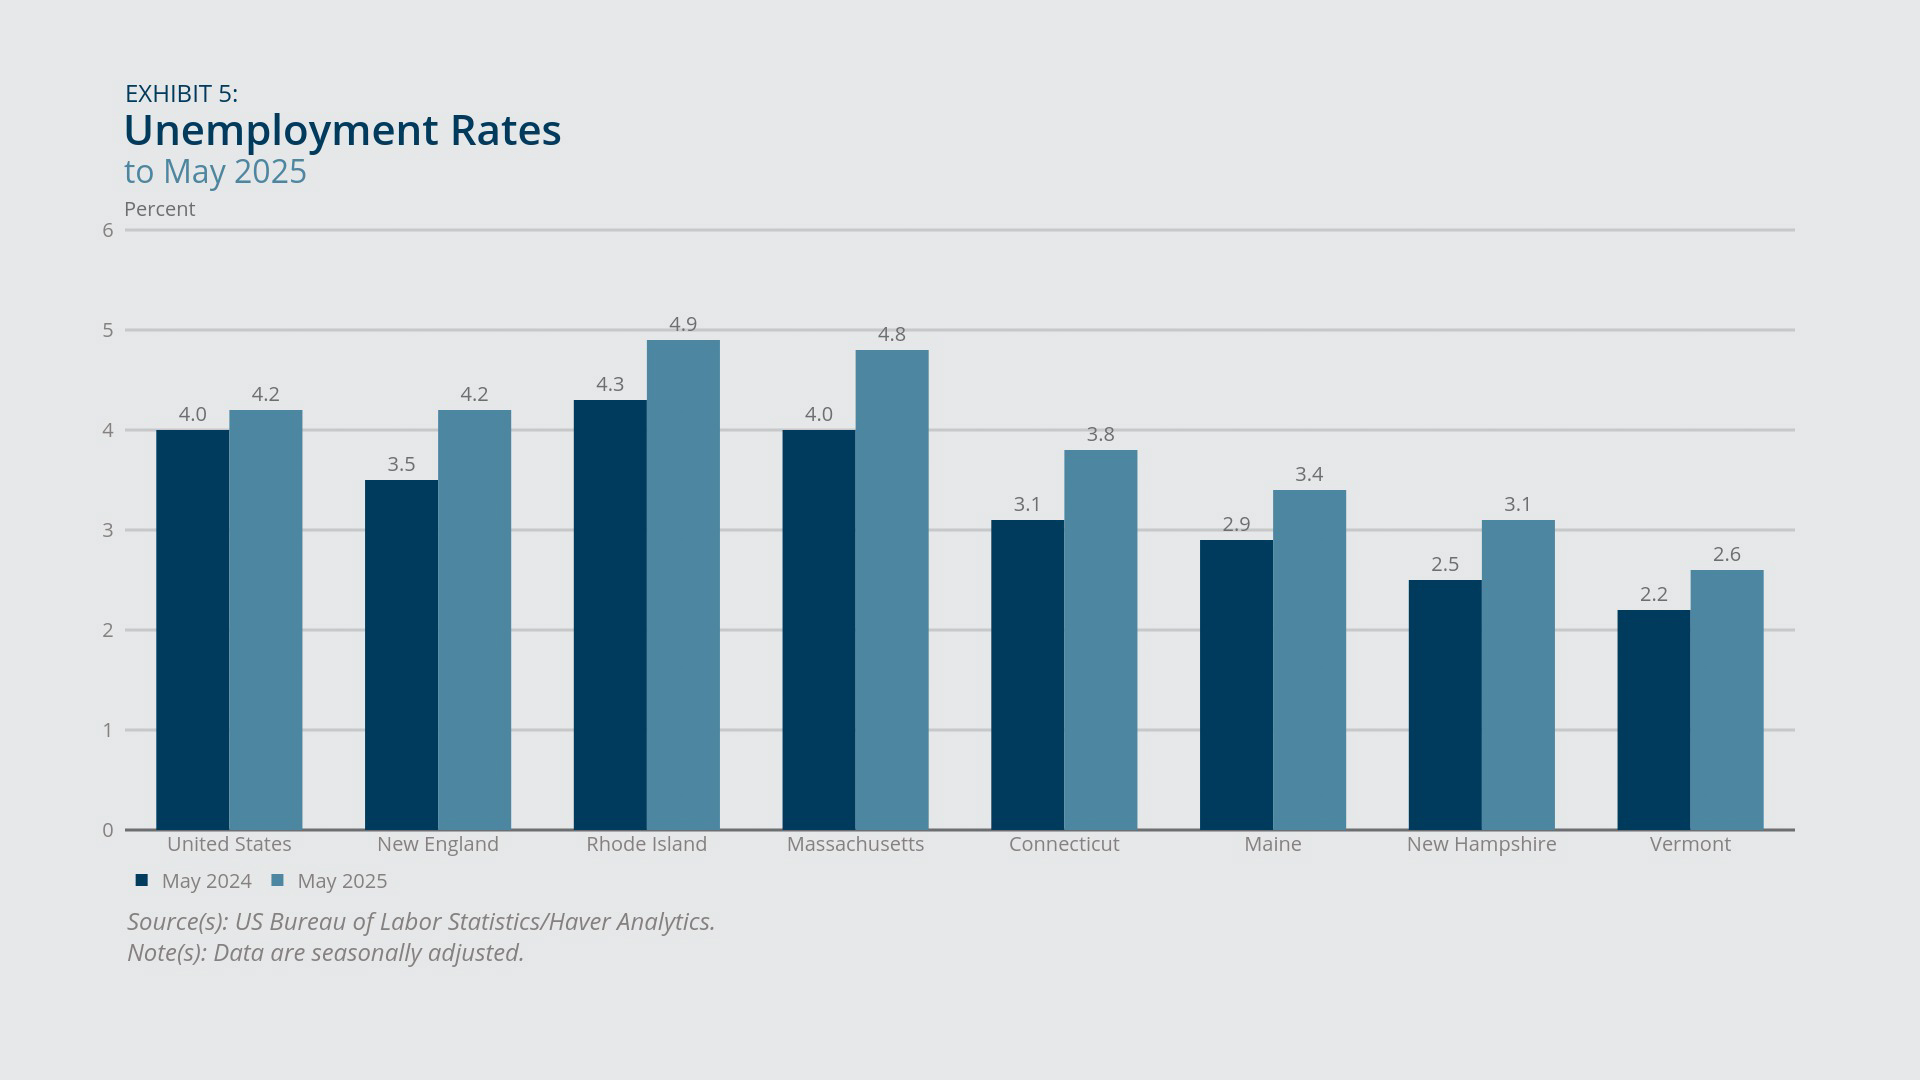
New England’s unemployment rate for May 2025 increased 0.7 percentage point from a year prior, reaching 4.2 percent, the same level as the US rate for that month (Exhibit 4). The regional rate had been consistently below the national rate since December 2021.
Vermont had the lowest unemployment rate in the region for May 2025 and the third lowest in the country at 2.6 percent (Exhibit 5).3 Conversely, Rhode Island had the highest unemployment rate in the region and the fifth highest in the country at 4.9 percent. Among the New England states, the year-over-year increase in the unemployment rate ranged from 0.4 percentage point for Vermont to 0.8 percentage point for Massachusetts.
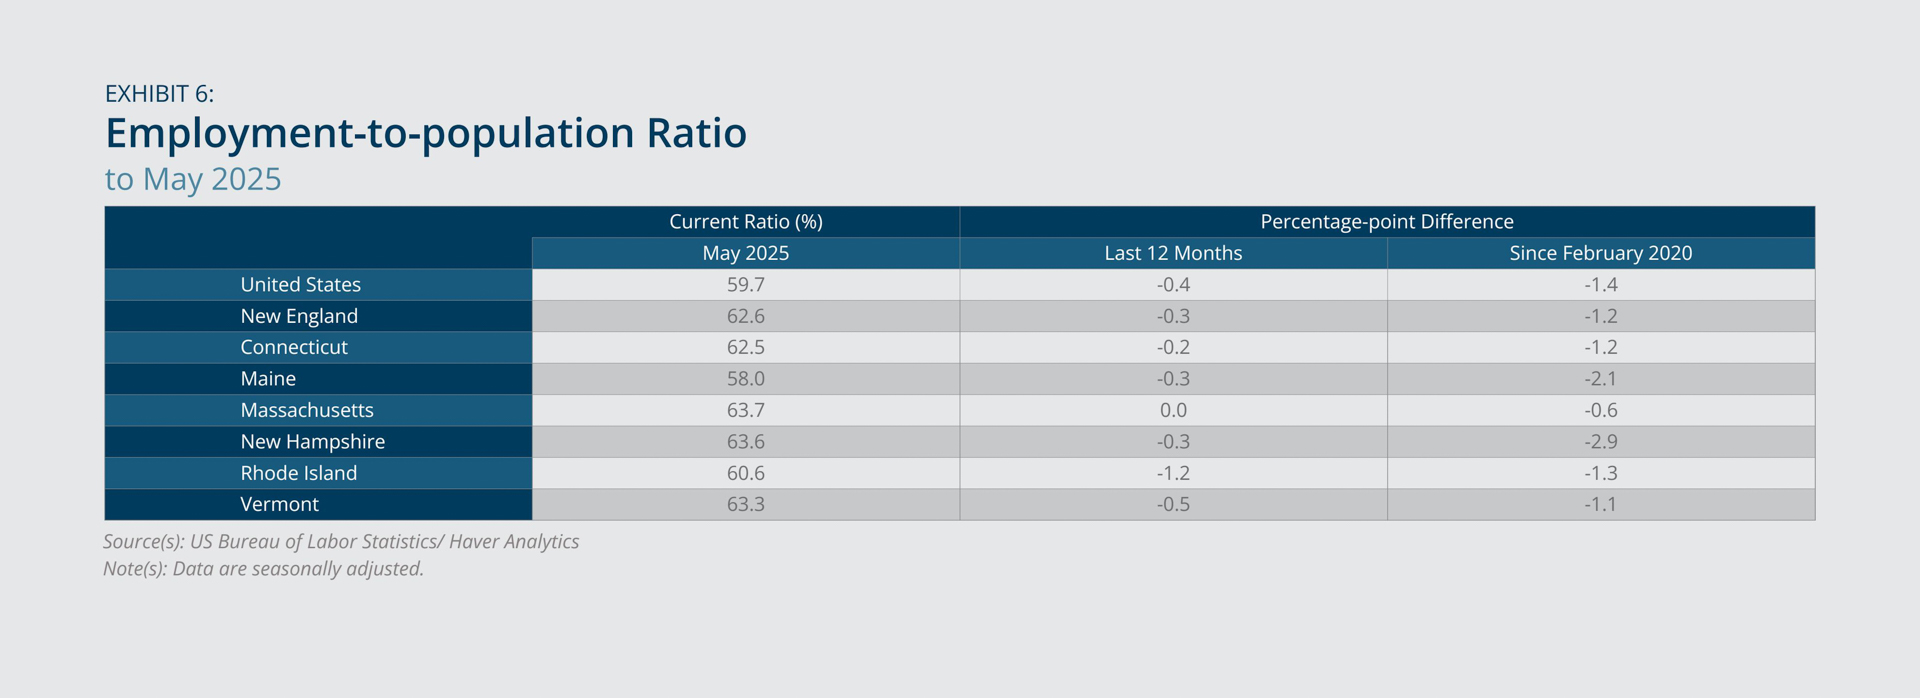
In May 2025, the employment-to-population ratio decreased 0.3 percentage point for New England and 0.4 percentage point for the United States from a year prior (Exhibit 6). The region saw a smaller decrease in the ratio because its population grew more slowly than the US population. Each New England state except Massachusetts experienced a drop in the ratio over the same 12-month period. At 1.2 percentage points, Rhode Island’s decline was the largest in the region and larger than the drop in the US ratio.
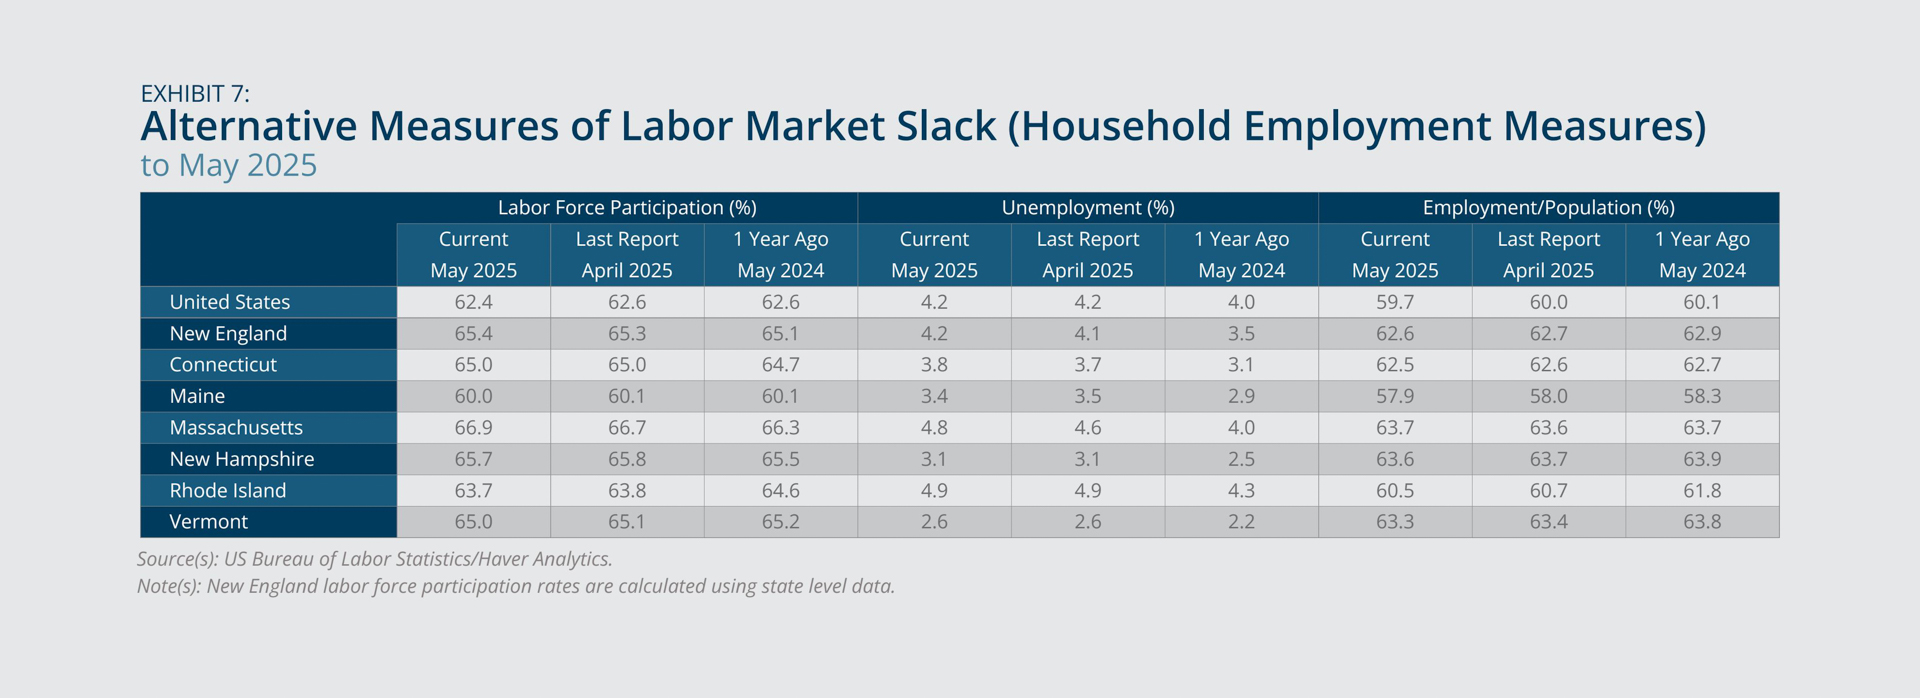
Labor force participation in New England improved slightly in May 2025 compared with a year prior (Exhibit 7). It increased 0.3 percentage point, while the US rate decreased 0.2 percentage point over the same period. The rise in the regional rate was driven mostly by the 0.6 percentage point increase for Massachusetts, which partly explains why Massachusetts had a year-over-year increase in the unemployment rate that was the largest in New England and larger than the US increase. By contrast, Rhode Island had the largest drop in labor force participation in the region at 0.9 percentage point.
Federal Reserve Bank of Boston
Federal Reserve Bank of Boston
Federal Reserve Bank of Boston
Federal Reserve Bank of Boston
Personal Income
- Over the one-year period ending with the first quarter of 2025, personal income grew slower in New England than across the country. Among the New England states, Massachusetts experienced the smallest gain.
- New England saw an even smaller year-over-year increase in wage and salary disbursements, particularly in Massachusetts, where wages and salaries grew less than 1 percent.
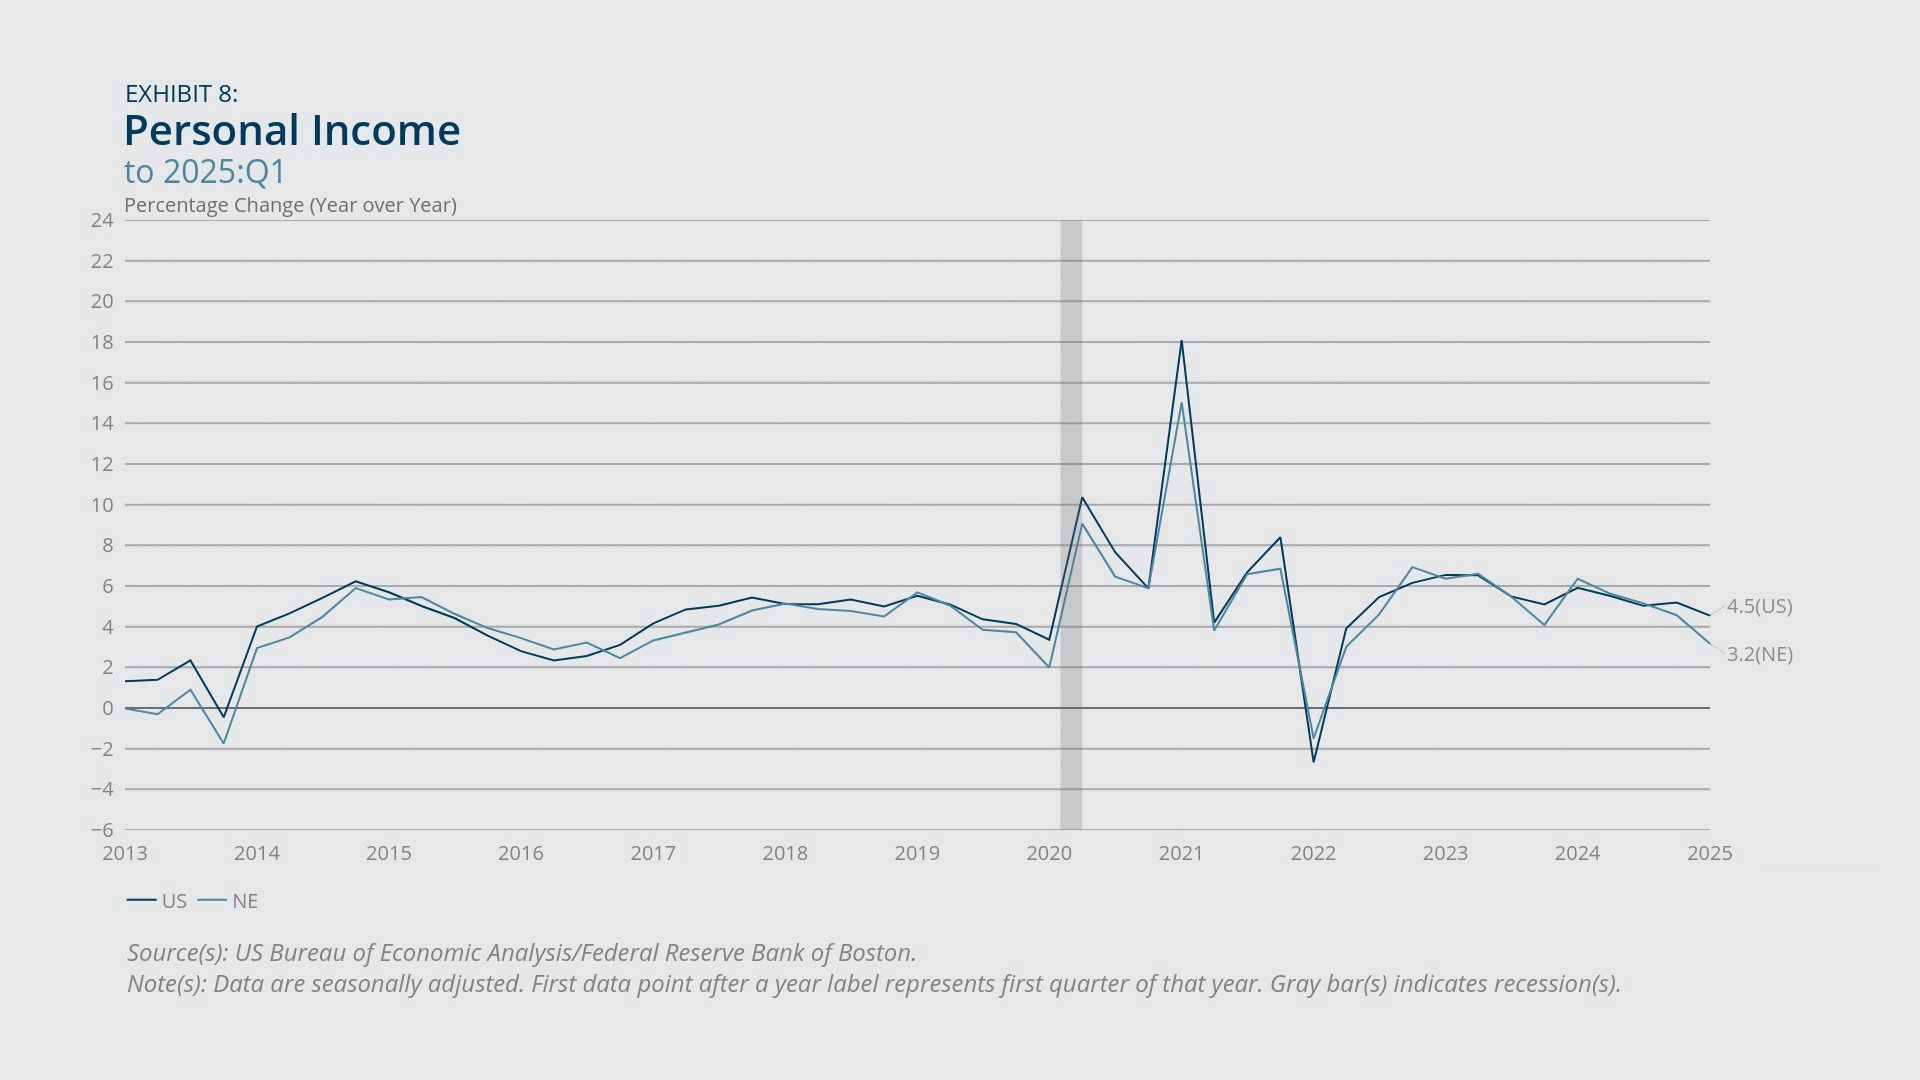
For the first quarter of 2025, year-over-year personal income growth was slower in New England than across the country (Exhibit 8). The year-over-year increase in nominal total personal income for New England was 1.3 percentage points lower than the increase for the United States. The gap between the national and regional income growth rates appeared to have widened from a 0.6 percentage point difference in the previous quarter. The region’s slower income growth is consistent with its more sluggish job growth from 2024:Q1 to 2025:Q1.
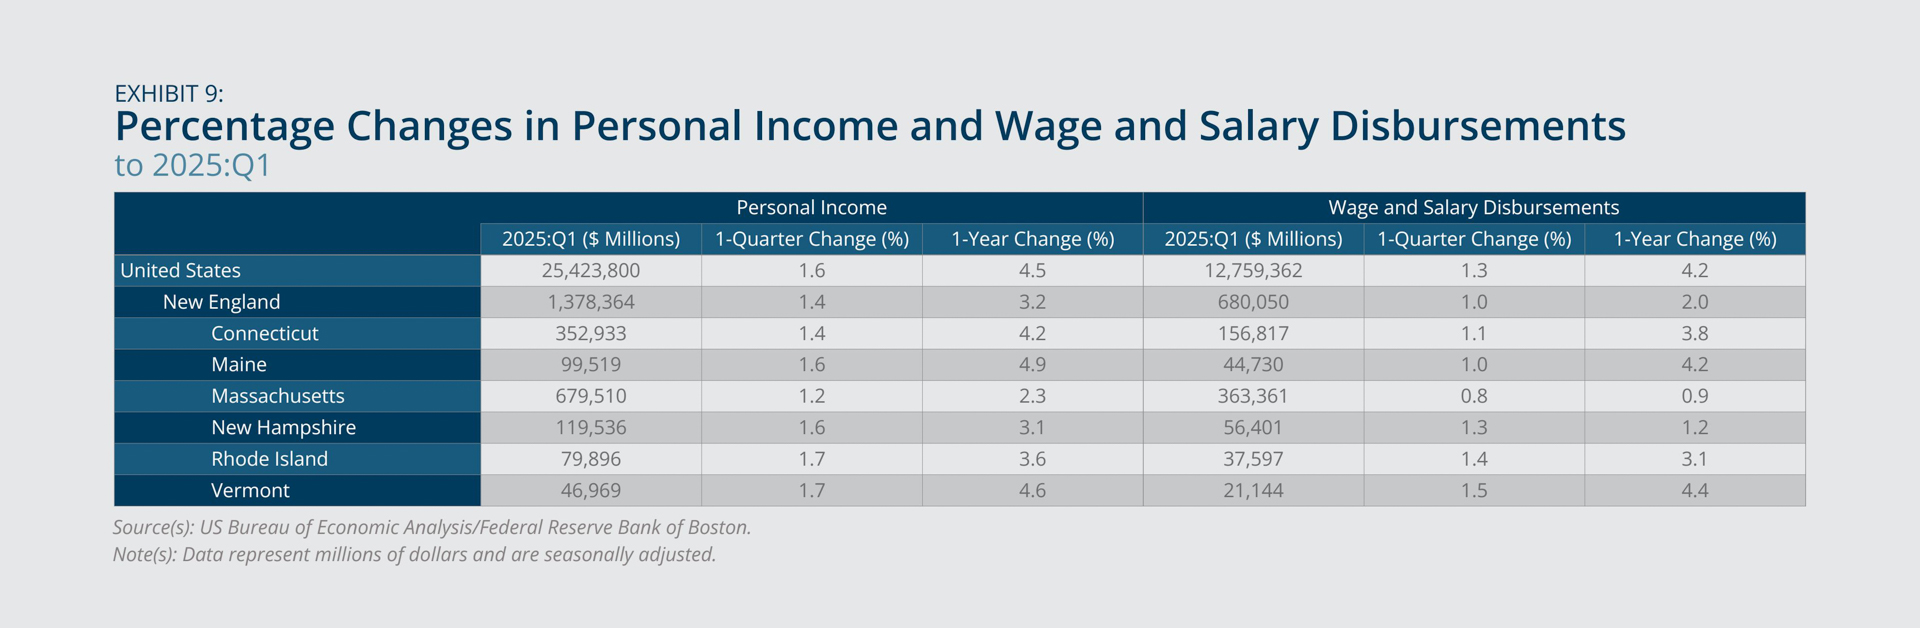
Massachusetts played the most important role in the region’s slow income growth. Over the one-year period, its nominal total personal income rose only 2.3 percent, which was the smallest increase across the New England states and about half the size of the US increase in income (Exhibit 9).
Wage and salary disbursements, which make up about half of total personal income, grew even slower in New England. They increased 2 percent from 2024:Q1 to 2025:Q1, compared with 4.2 percent for the United States. Massachusetts saw the region’s smallest increase from a year prior, at only 0.9 percent.
Federal Reserve Bank of Boston
Federal Reserve Bank of Boston
Inflation
- New England has continued to see a decrease in overall inflation since February 2025, but its inflation rate remained higher than the US rate in May 2025.
- Shelter prices in New England increased nearly 6 percent from May 2024 to May 2025, while transportation prices decreased more than 15 percent in the region over the same period.
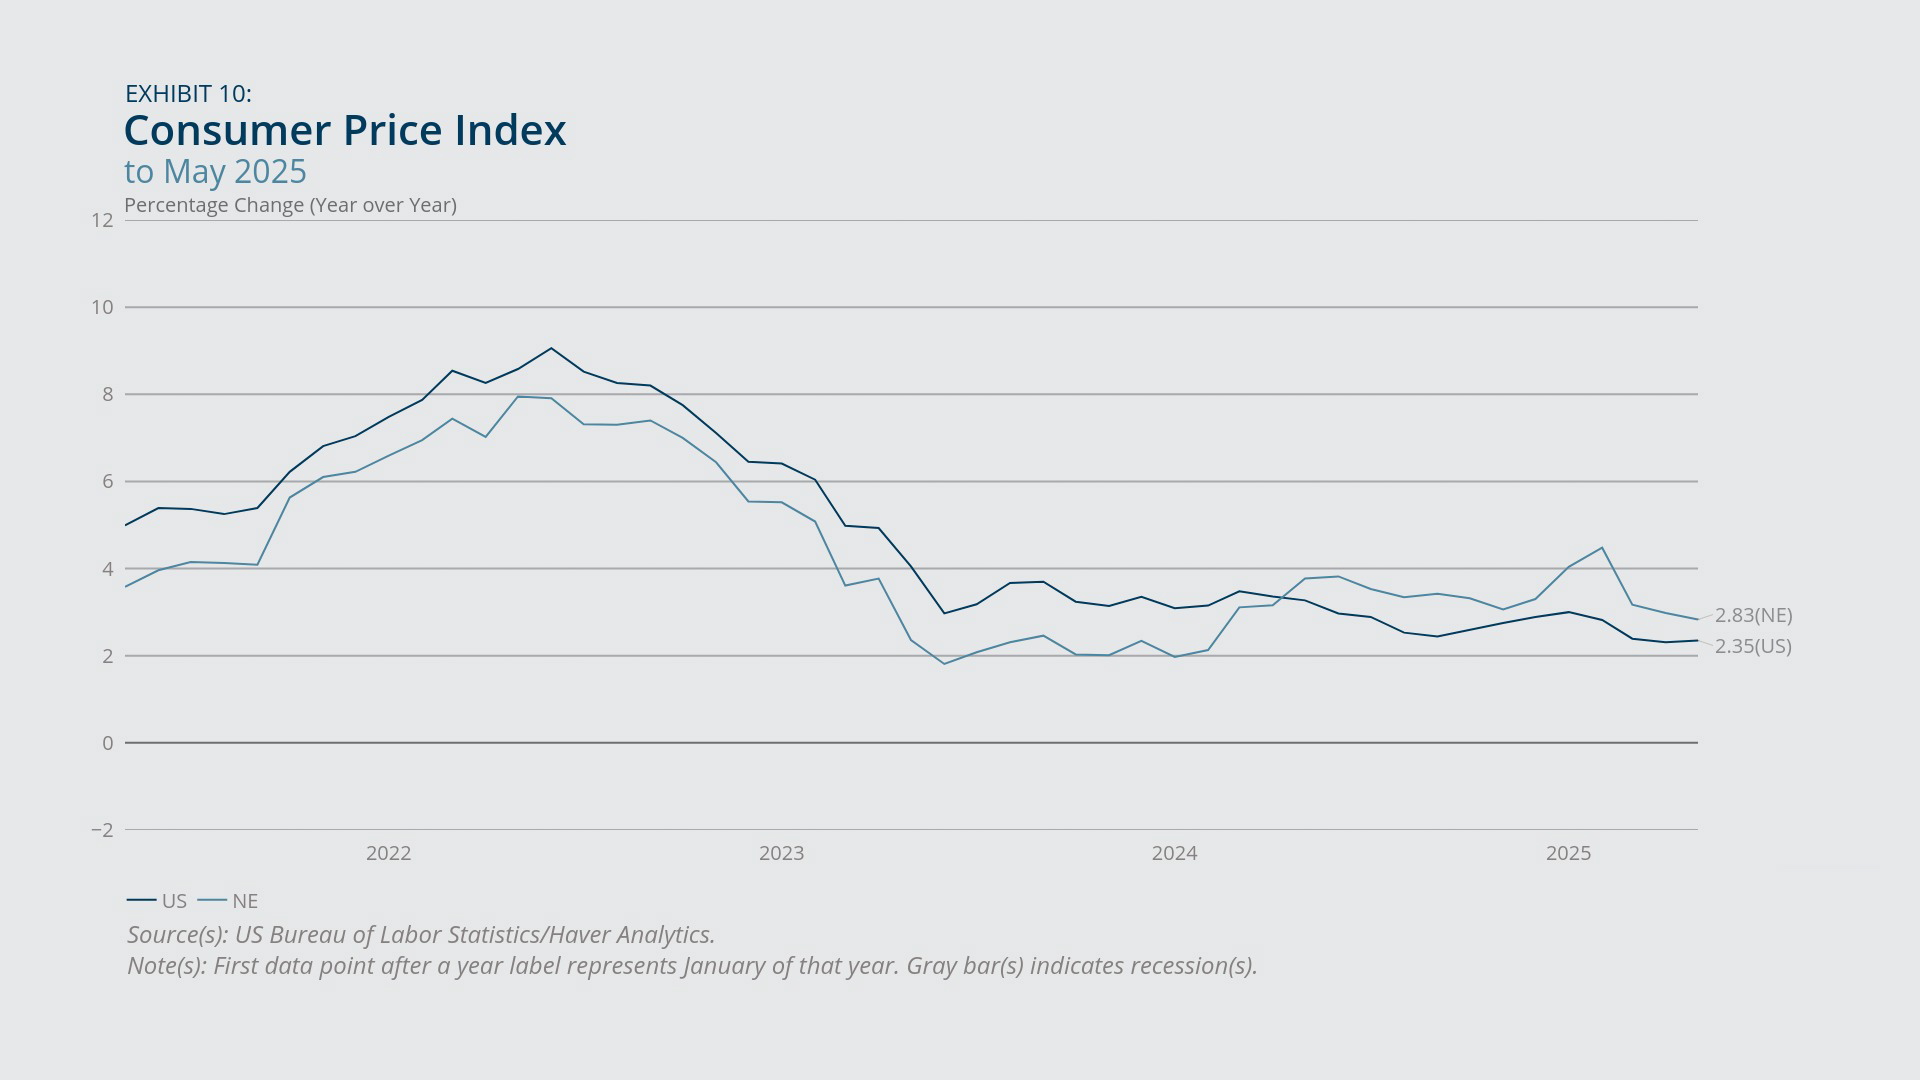
According to the year-over-year change in the Consumer Price Index, overall inflation in New England continued to decrease from February to May 2025 (Exhibit 10). However, at 2.8 percent in May 2025, it was higher than the national rate of 2.4 percent.
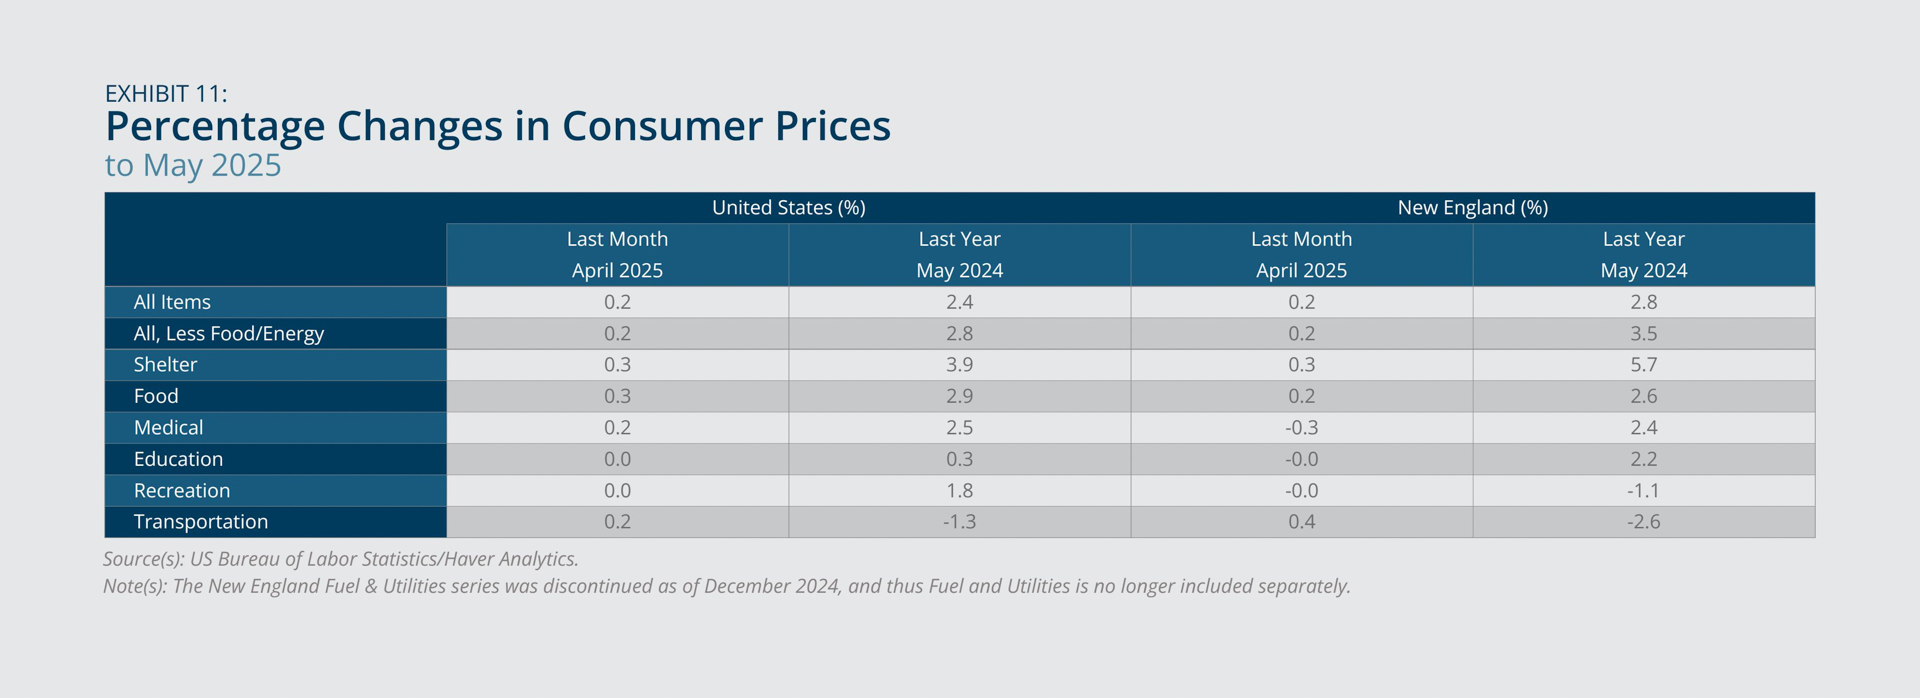
The higher inflation in New England was driven mostly by a year-over-year increase in shelter prices that was larger than the national increase in those prices (5.7 percent versus 3.9 percent) (Exhibit 11). By contrast, transportation prices in New England dropped 2.6 percent compared with a year prior, which was a larger than the national drop in those prices. The regional decrease was attributable entirely to a 15.5 percent drop in gasoline prices.
Federal Reserve Bank of Boston
Federal Reserve Bank of Boston
Endnotes
- While regional employment growth was slower than national employment growth, that trend is consistent with the historical norm. The regional rate was generally lower than the national rate in the period before the COVID-19 pandemic, as shown in Exhibit 1. New England’s 30-year moving average rate is also lower than the US 30-year moving average rate. The slower regional employment growth is driven partly by population growth that is slower than the national rate.
- Employment in educational services in New England increased 0.8 percent from May 2024 to May 2025. Health-care and social-assistance employment in the region grew faster during the same period, at 1.7 percent.
- New Hampshire had the seventh-lowest unemployment rate in the country for May 2025. For the ranking of unemployment rates for all 50 states and the District of Columbia, see US Bureau of Labor Statistics, Local Area of Unemployment Statistics, https://www.bls.gov/web/laus/laumstrk.htm (accessed July 7, 2025).

 About the Authors
Bo Zhao,
Federal Reserve Bank of Boston
Bo Zhao is a principal economist with the New England Public Policy Center in the Federal Reserve Bank of Boston Research Department.
Email: Bo.Zhao@bos.frb.org
Acknowledgments
Kelly Jackson, a senior data analyst in the Federal Reserve Bank of Boston Research Department, prepared the exhibits for this memo.
Resources
Keywords
- Regional economy ,
- Economic Conditions ,
- New England ,
- NEPPC