Q3 2017: Snapshot of the New England Economy through October 10, 2017 

PeopleImages/iStocck


Economic activity continued to improve throughout 2017
In the first half of 2017, economic conditions continued to improve in both New England and the United States along several indicators. Payroll employment increased, home prices rose, and wage and salary income were higher relative to one year prior, although the changes in economic conditions varied across the New England states. Over this period, the unemployment rate declined in five of the six New England states, and the unemployment rate in the region remained below the national average.
Payroll Employment
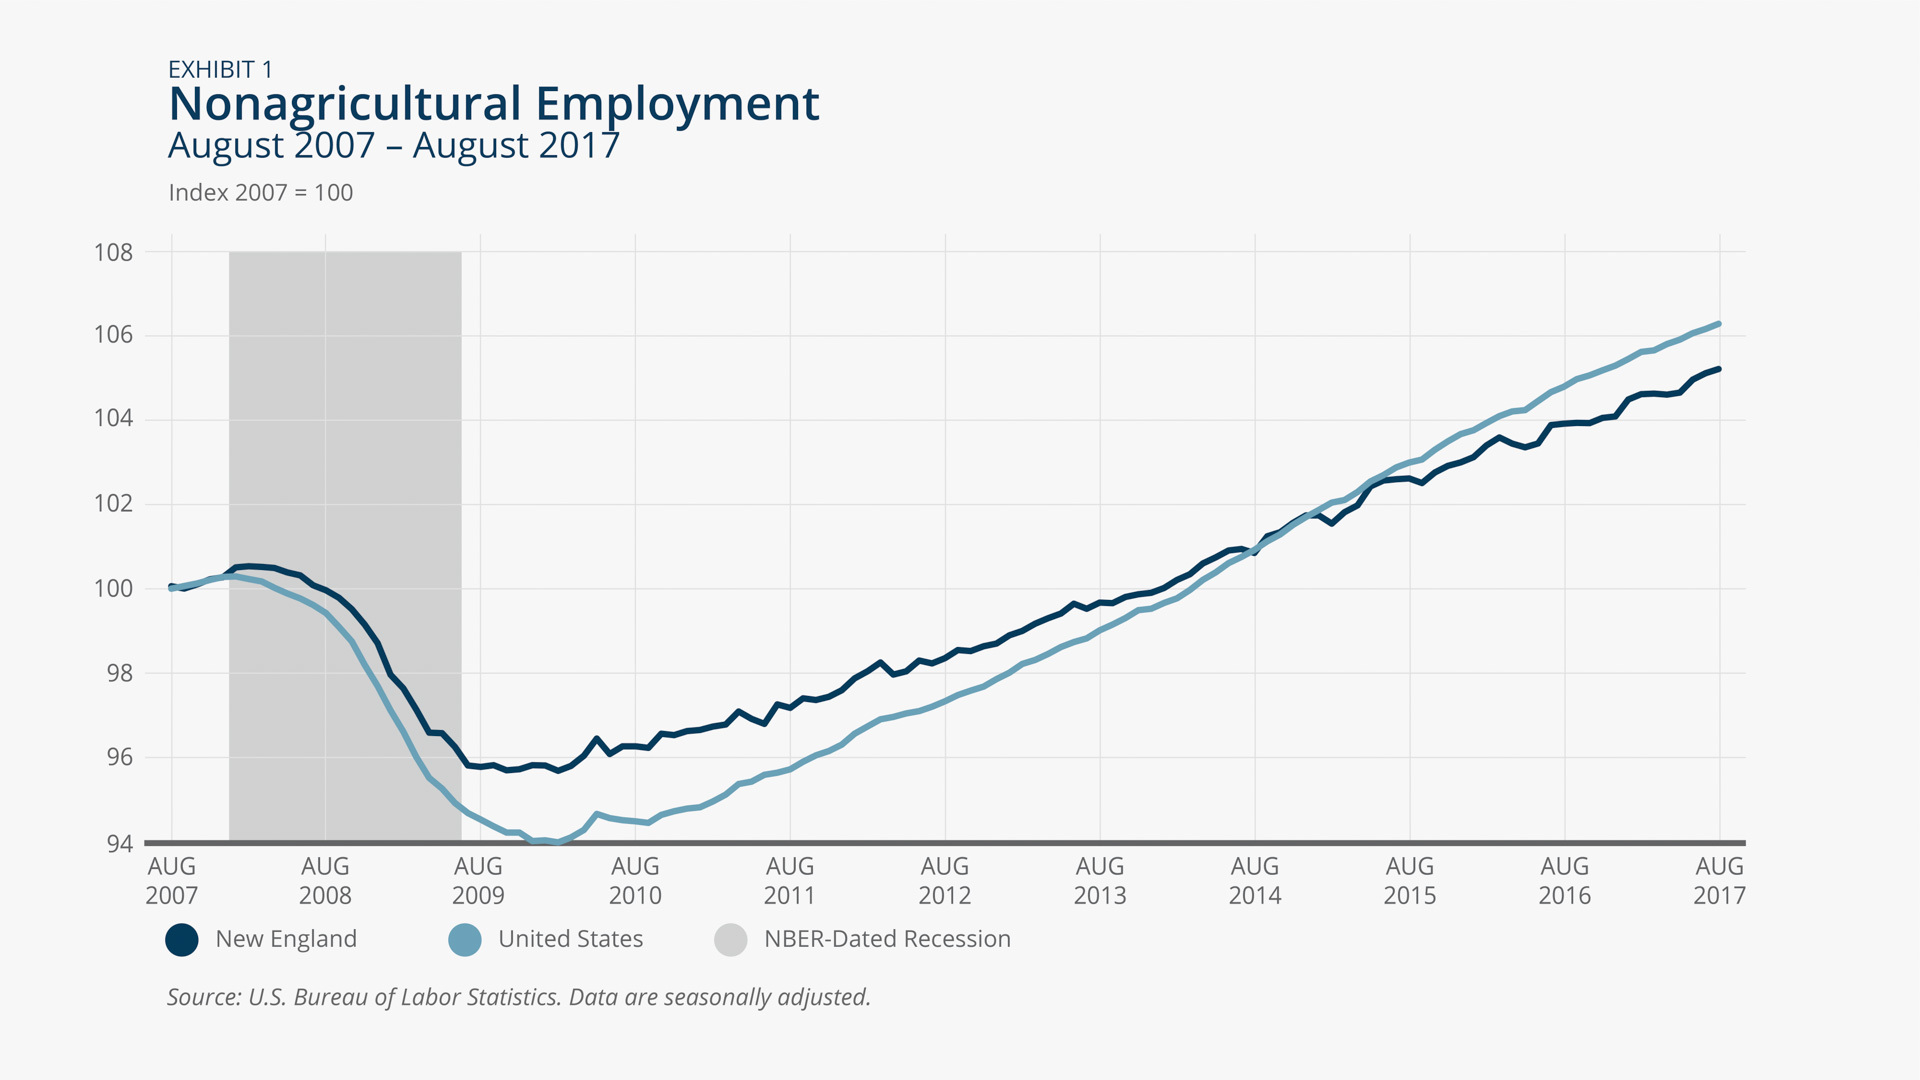
Employment gains in 2017
The United States and New England continued to post job gains through August 2017. Between August 2016 and August 2017, payroll employment increased 1.4 percent nationally and 1.2 percent regionally (Exhibit 1). Although employment increased since August 2016 in each New England state, job growth rates over that period varied across those states. Within New England, New Hampshire posted the strongest year-over-year job gains through August 2017 (increasing 2.1 percent), and along with Rhode Island (1.9 percent) and Massachusetts (1.6 percent) exceeded the national job growth pace during that time period. Connecticut posted the slowest employment growth in the region, with job gains of just 0.4 percent over this time period.
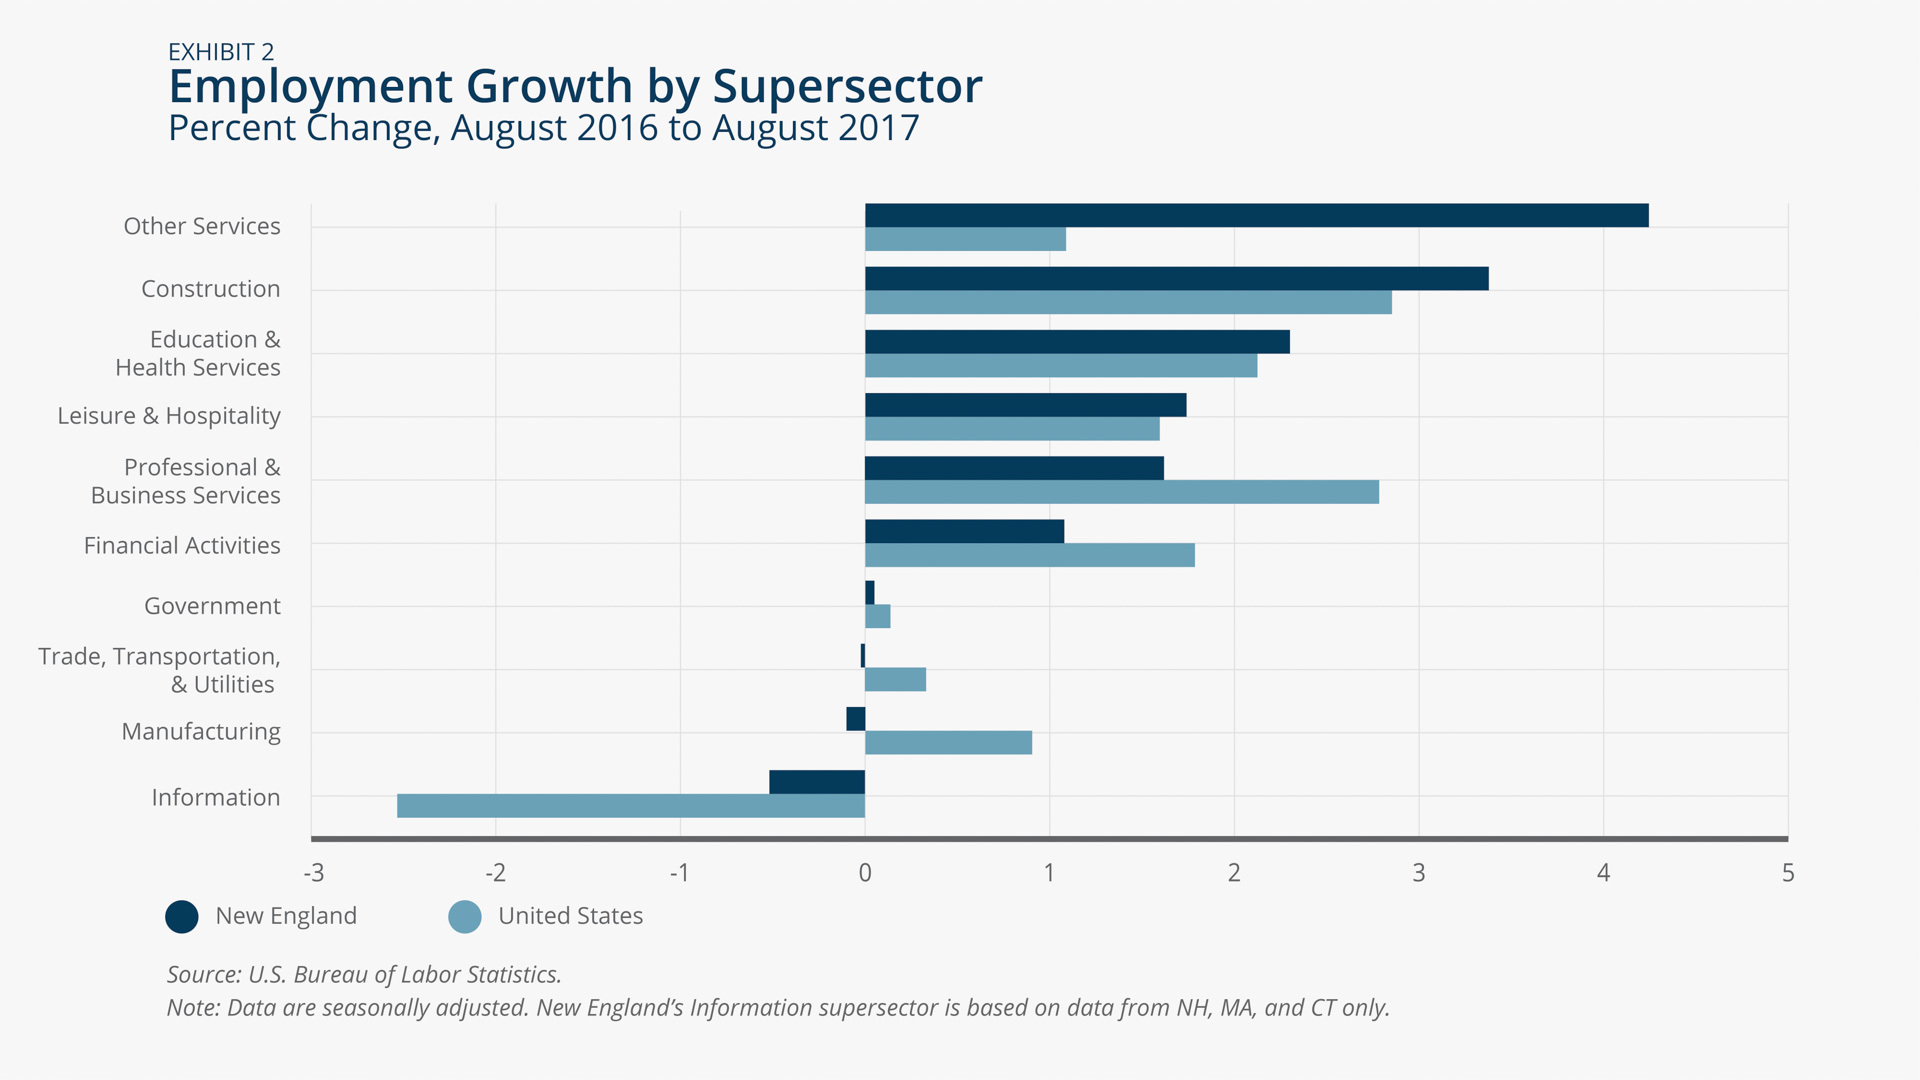
Manufacturing sees job losses in New England despite adding jobs in U.S.
From August 2016 to August 2017, Construction, Education & Health Services, and Other Services in New England outpaced employment growth in those supersectors nationally (Exhibit 2). For that time period, Manufacturing employment shrank in the region by 0.1 percent despite growth nationally of 0.9 percent. Manufacturing employment decreased in four of six New England states, while both Rhode Island (up 2.0 percent) and New Hampshire (up 0.4 percent) experienced increases in manufacturing employment. Employment in Information dropped 2.2 percent year-over-year nationally, but in New England the supersector had a more modest 0.5 percent decline.
Alex Cronin/Federal Reserve Bank of Boston
Alex Cronin/Federal Reserve Bank of Boston
Unemployment
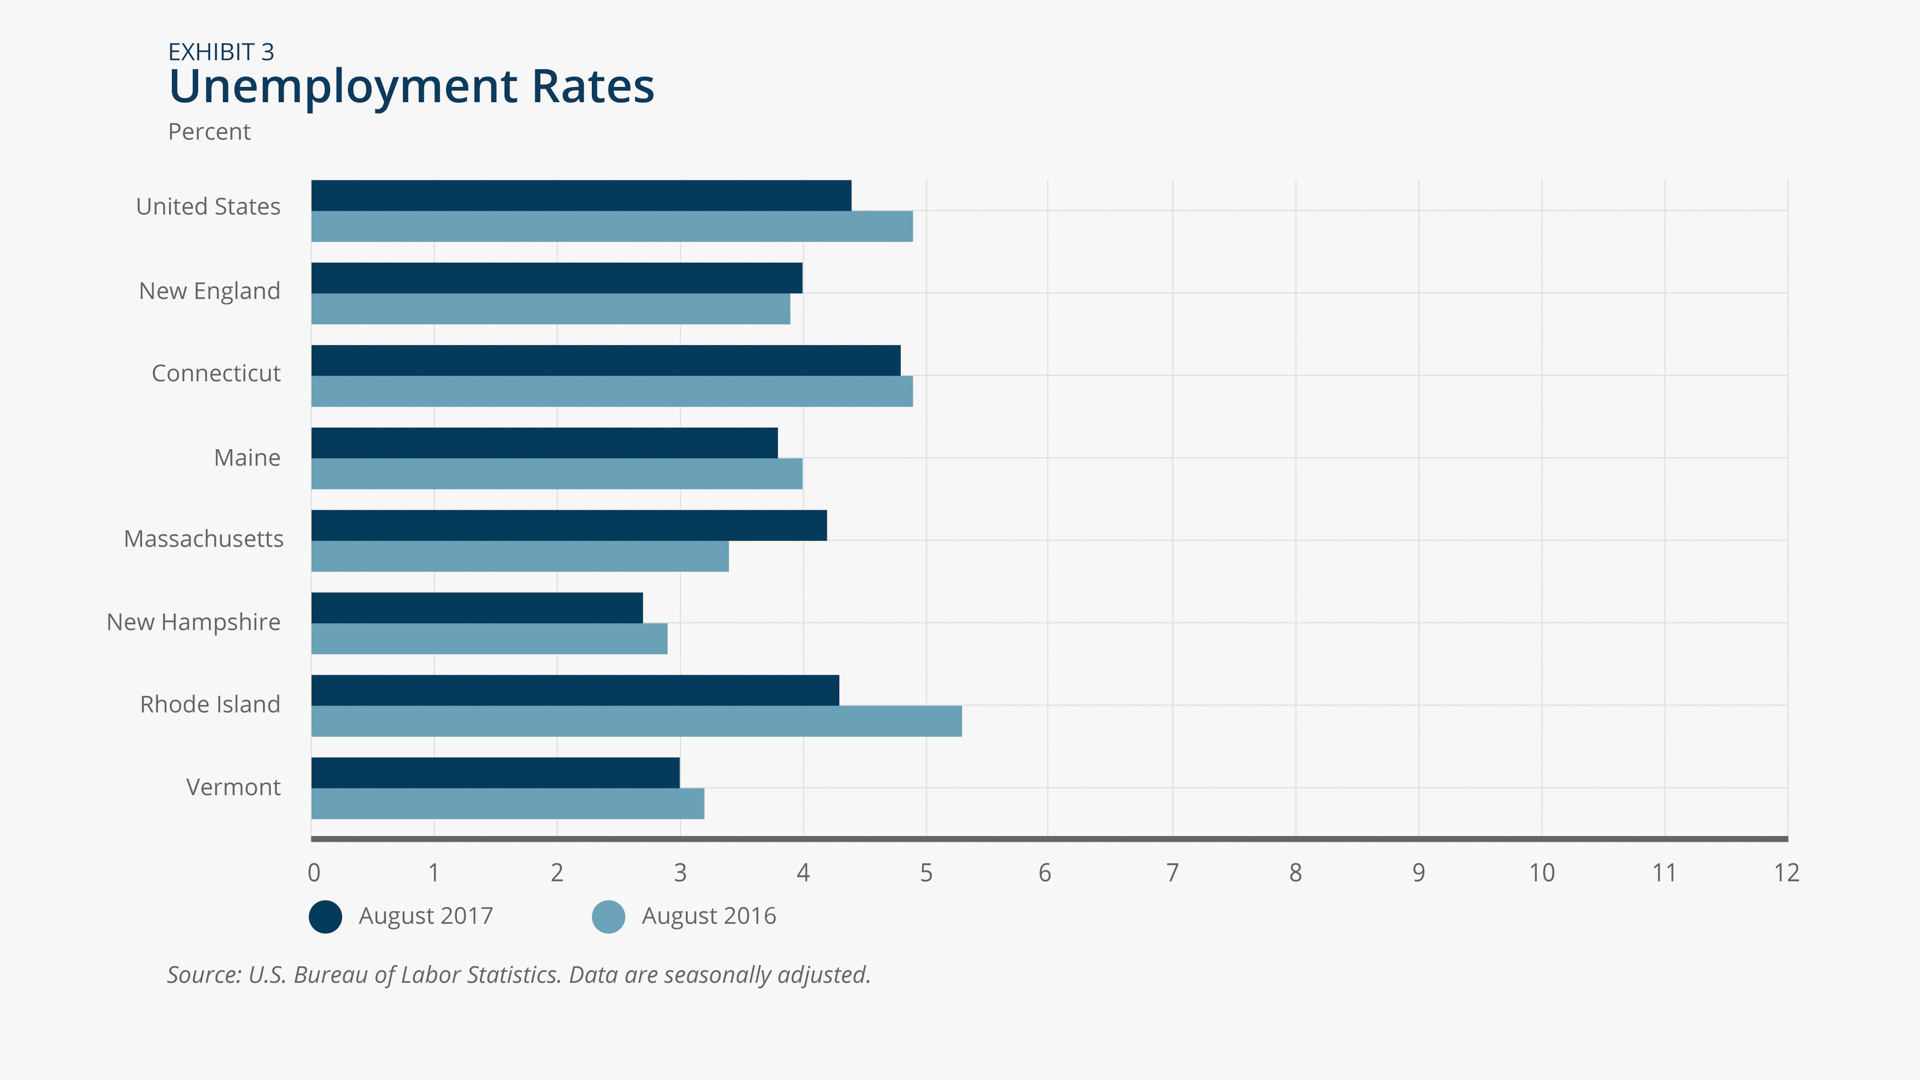
Unemployment rates declined in five New England states
Five of the six New England states saw unemployment rate declines between August 2016 and August 2017, with the exception of Massachusetts, which experienced an increase of 0.8 percentage points (Exhibit 3). Massachusetts' unemployment rate increased partly because its labor force participation rate rose from 64.8 percent in August 2016 to 66.1 percent in August 2017. Considering the region as a whole, the unemployment rate increased 0.1 percentage points over the year, to land at 4.0 percent, up from a low of 3.6 percent in January 2017. Rhode Island experienced the steepest unemployment rate decline among New England states (1.0 percentage points). New Hampshire retained the lowest unemployment rate in the region (2.7 percent) followed by Vermont at 3.0 percent. Connecticut is the only state in the region with an unemployment rate as of August 2017 (4.8 percent) that exceeds the national rate (4.4 percent).
Alex Cronin/Federal Reserve Bank of Boston
Income
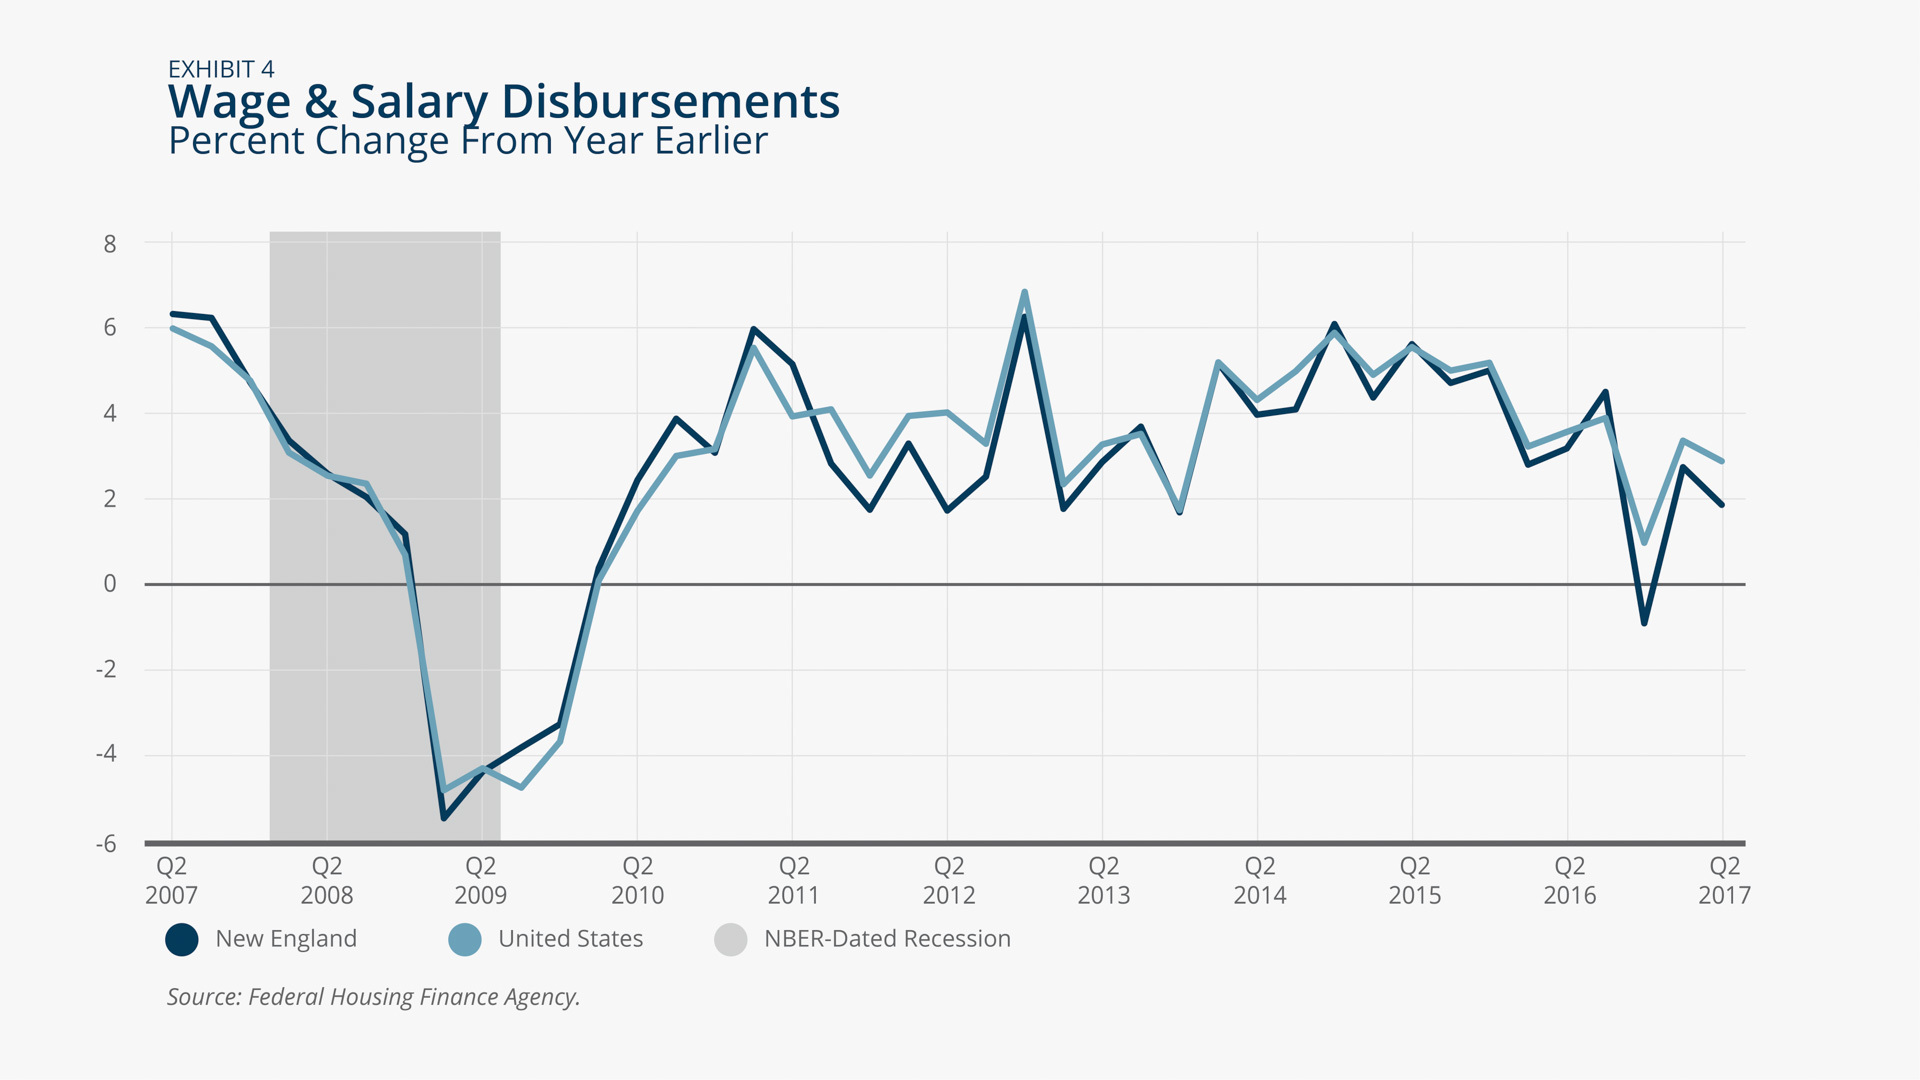
Wage and salary income growth continues
Incomes in New England and the United States continued to grow at a moderate pace through the first half of 2017. Wage and salary disbursements, the largest component of income, increased year-over-year by 2.9 percent nationally and 1.9 percent regionally in Q2 2017 (Exhibit 4). Wages and salary growth in the New England states ranged from 1.2 percent in Rhode Island to 3.1 percent in Massachusetts. Connecticut was the sole New England state to report a decrease in wage and salary disbursements, down 1.0 percent in the period considered.
Alex Cronin/Federal Reserve Bank of Boston
Home Prices
Massachusetts records fastest house price growth in the region
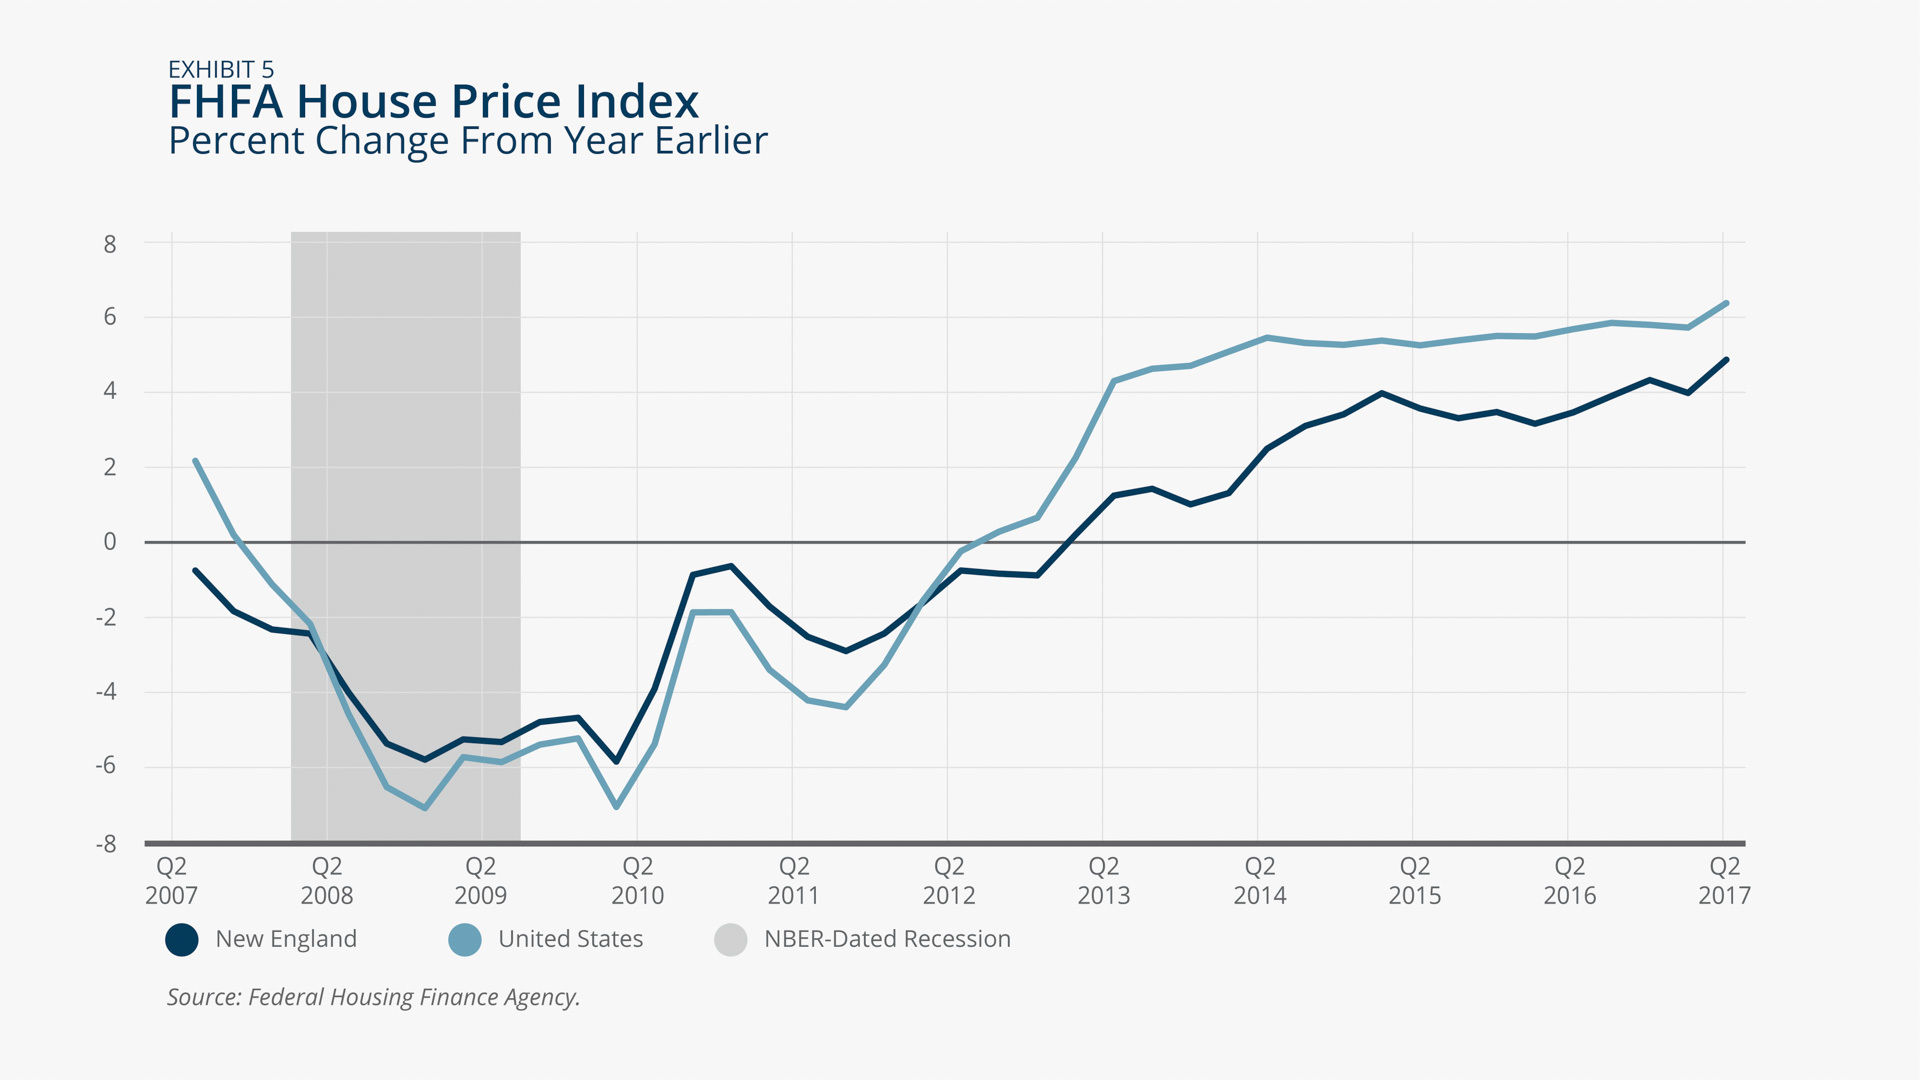
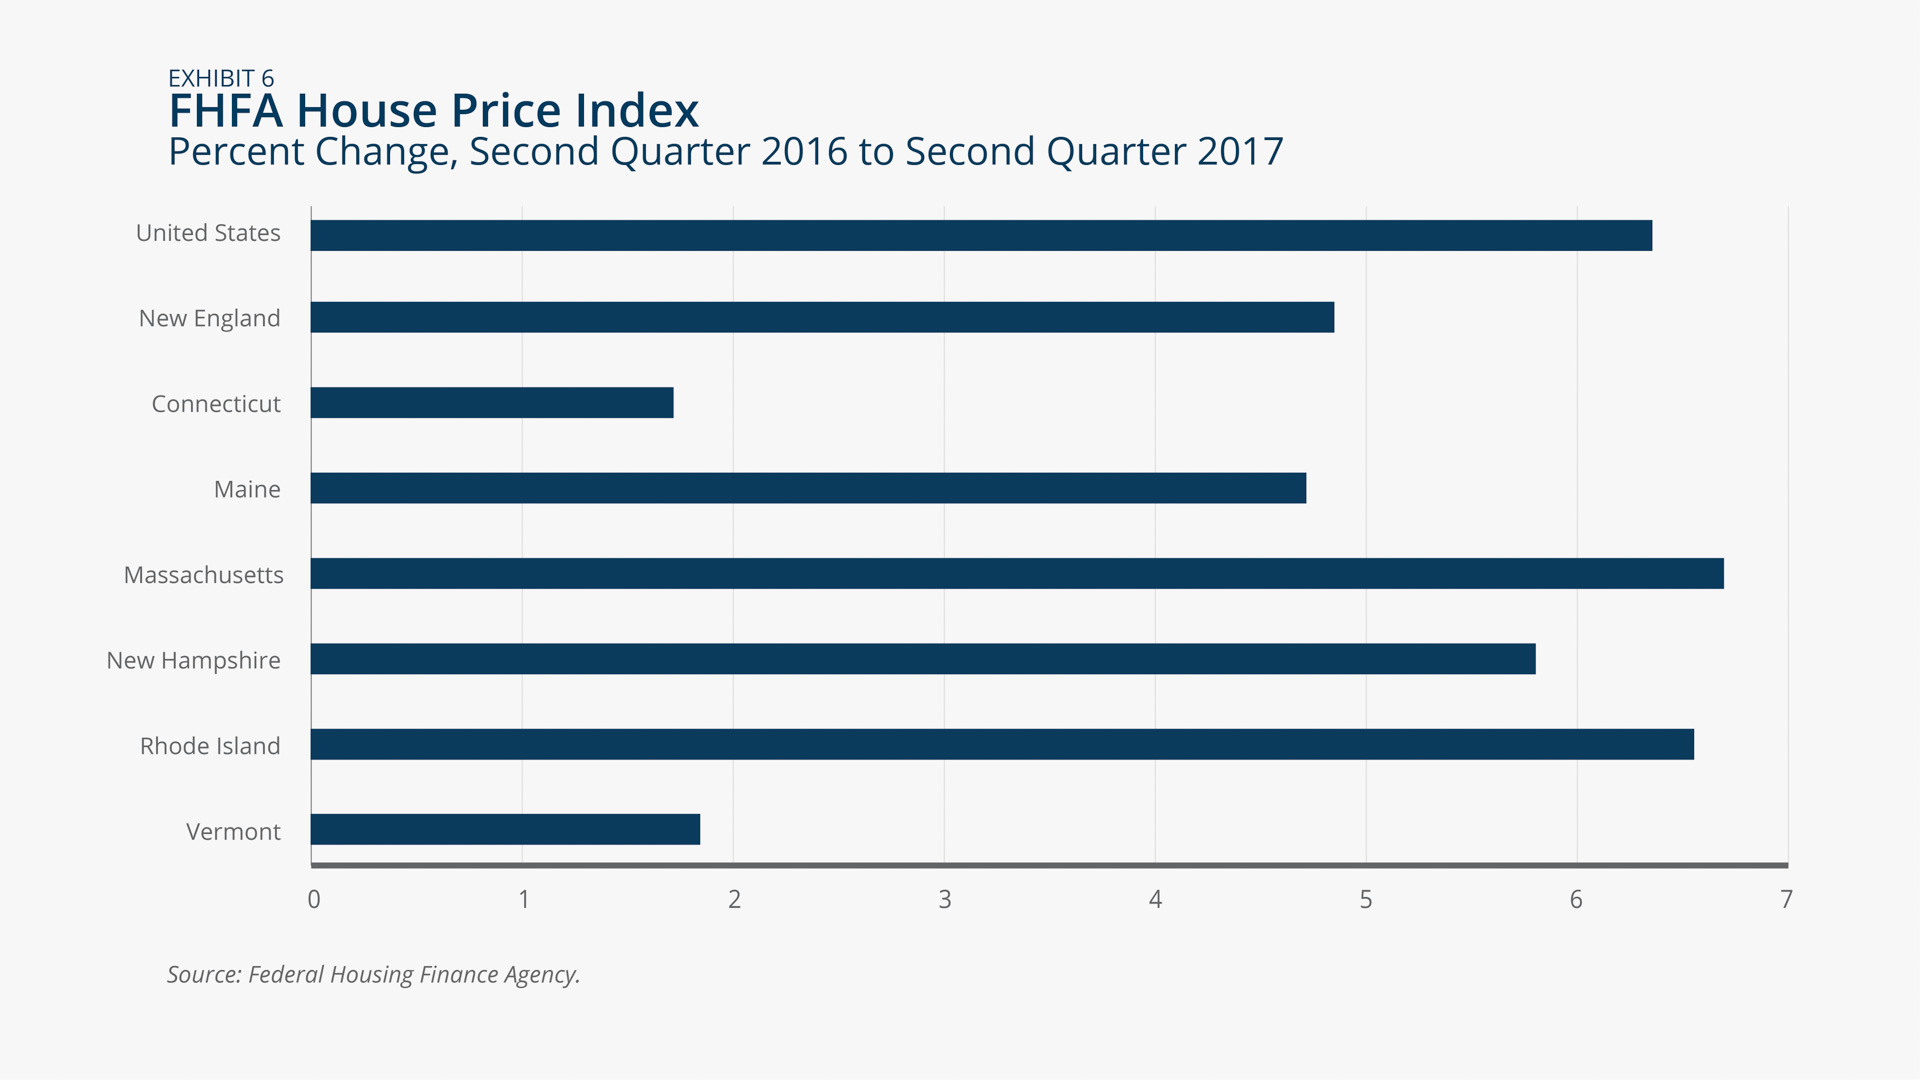
Home prices continued to rise both nationally and regionally, with national growth rates continuing to exceed regional rates (Exhibit 5). Between Q2 2016 and Q2 2017, home prices increased 6.4 percent nationally and 4.8 percent regionally. All six New England states reported positive house price growth year-over-year (Exhibit 6), but with the exception of Massachusetts (6.7 percent) and Rhode Island (6.6 percent), these gains trailed the national growth rate. House price growth in Connecticut was the lowest in the region over the same period, at 1.7 percent.
Alex Cronin/Federal Reserve Bank of Boston
Alex Cronin/Federal Reserve Bank of Boston

 About the Authors
Riley Sullivan,
Federal Reserve Bank of Boston
Riley Sullivan is a senior policy analyst with the New England Public Policy Center in the Federal Reserve Bank of Boston Research Department.
Email: riley.sullivan@bos.frb.org