Q4 2017: Snapshot of the New England Economy through January 3, 2018 


Economic activity continued to increase throughout 2017
In 2017, economic conditions continued to improve in both New England and the United States along several indicators. Payroll employment increased, home prices rose, and inflation remained modest, although the changes in economic conditions varied across the New England states. Between November 2016 and November 2017 the regional unemployment rate remained below the national average and four of the six New England states experienced declines in unemployment.
Payroll Employment
Employment gains in 2017
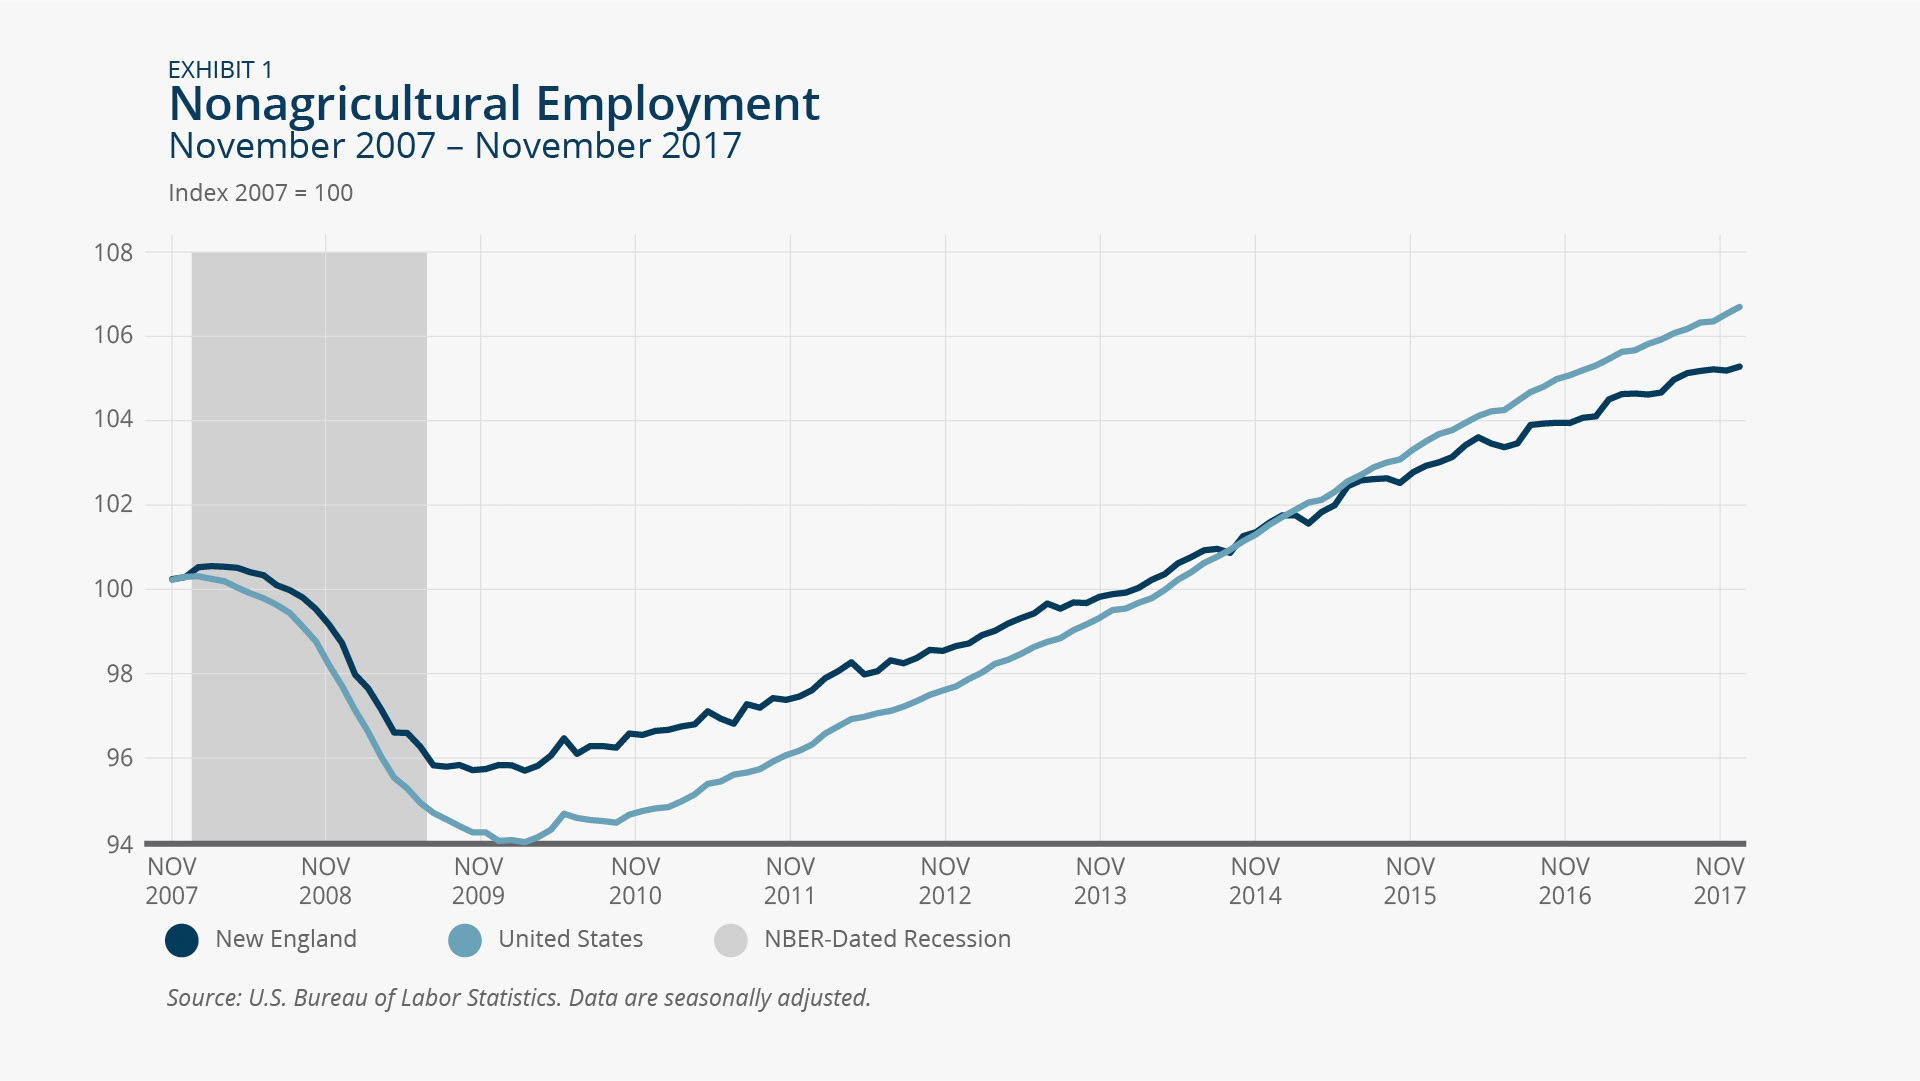
The United States and New England continued to post job gains through November 2017. Between November 2016 and November 2017, payroll employment increased 1.4 percent nationally and 1.2 percent regionally (Exhibit 1). Although employment increased since November 2016 in five of the six New England states, job growth rates over that period varied within the region. Within New England, Massachusetts posted the strongest year-over-year job gains through November 2017 (increasing 1.8 percent), and along with Vermont (1.6 percent) exceeded the national job growth pace during that time period. Payroll employment in Connecticut decreased year-over-year, albeit by less than 0.1 percent.
Construction job gains in New England continue to outpace the national average
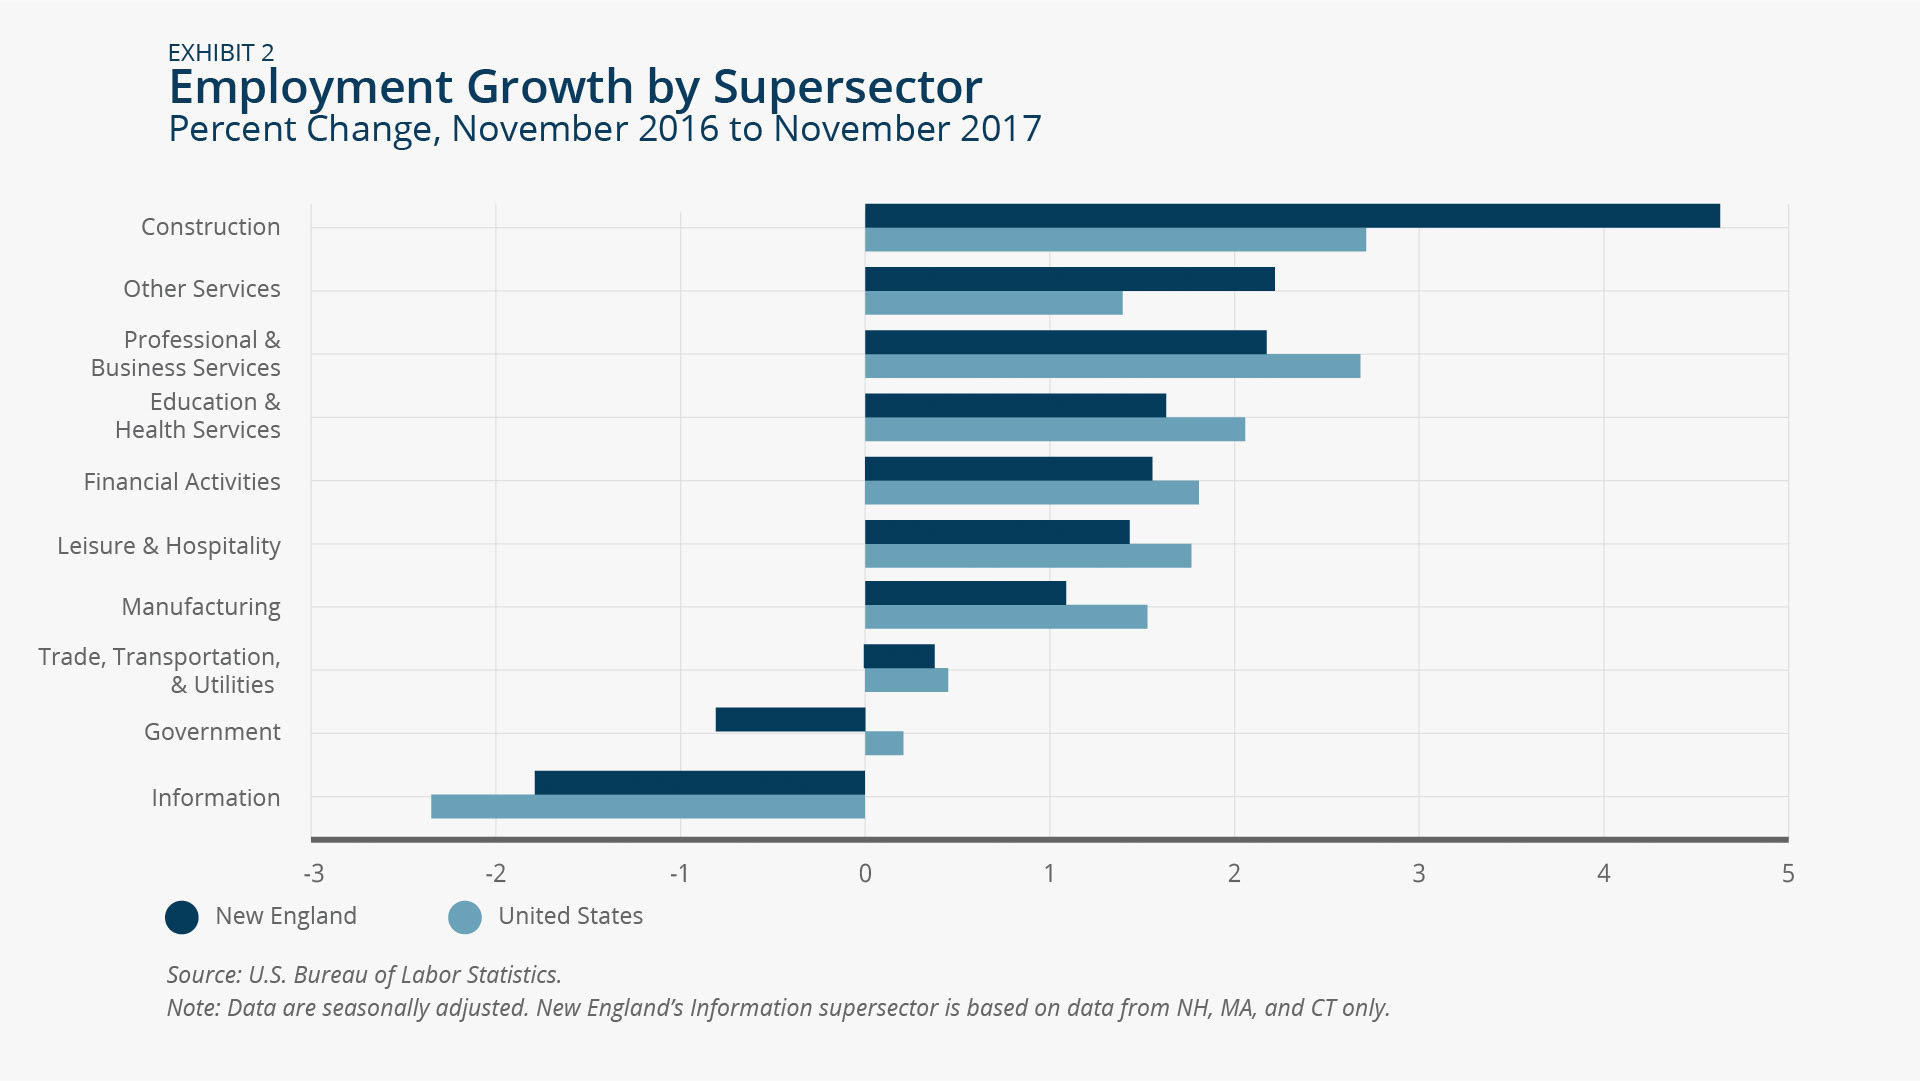
Over the year to November 2017, the Construction supersector led the region in employment growth, with gains that outpaced the national average for Construction (Exhibit 2). Over the same time period, Government employment shrank in the region by 0.8 percent despite growth nationally of 0.2 percent. Manufacturing employment increased in five of six New England states; Rhode Island was the lone New England state to experience Manufacturing job growth (3.8 percent) in excess of the national average for that supersector (1.5 percent). Employment in the Information supersector dropped 2.3 percent year-over-year nationally, while in New England Information employment declined by a slightly more modest 1.8 percent.

Unemployment
Unemployment rates declined in four New England states
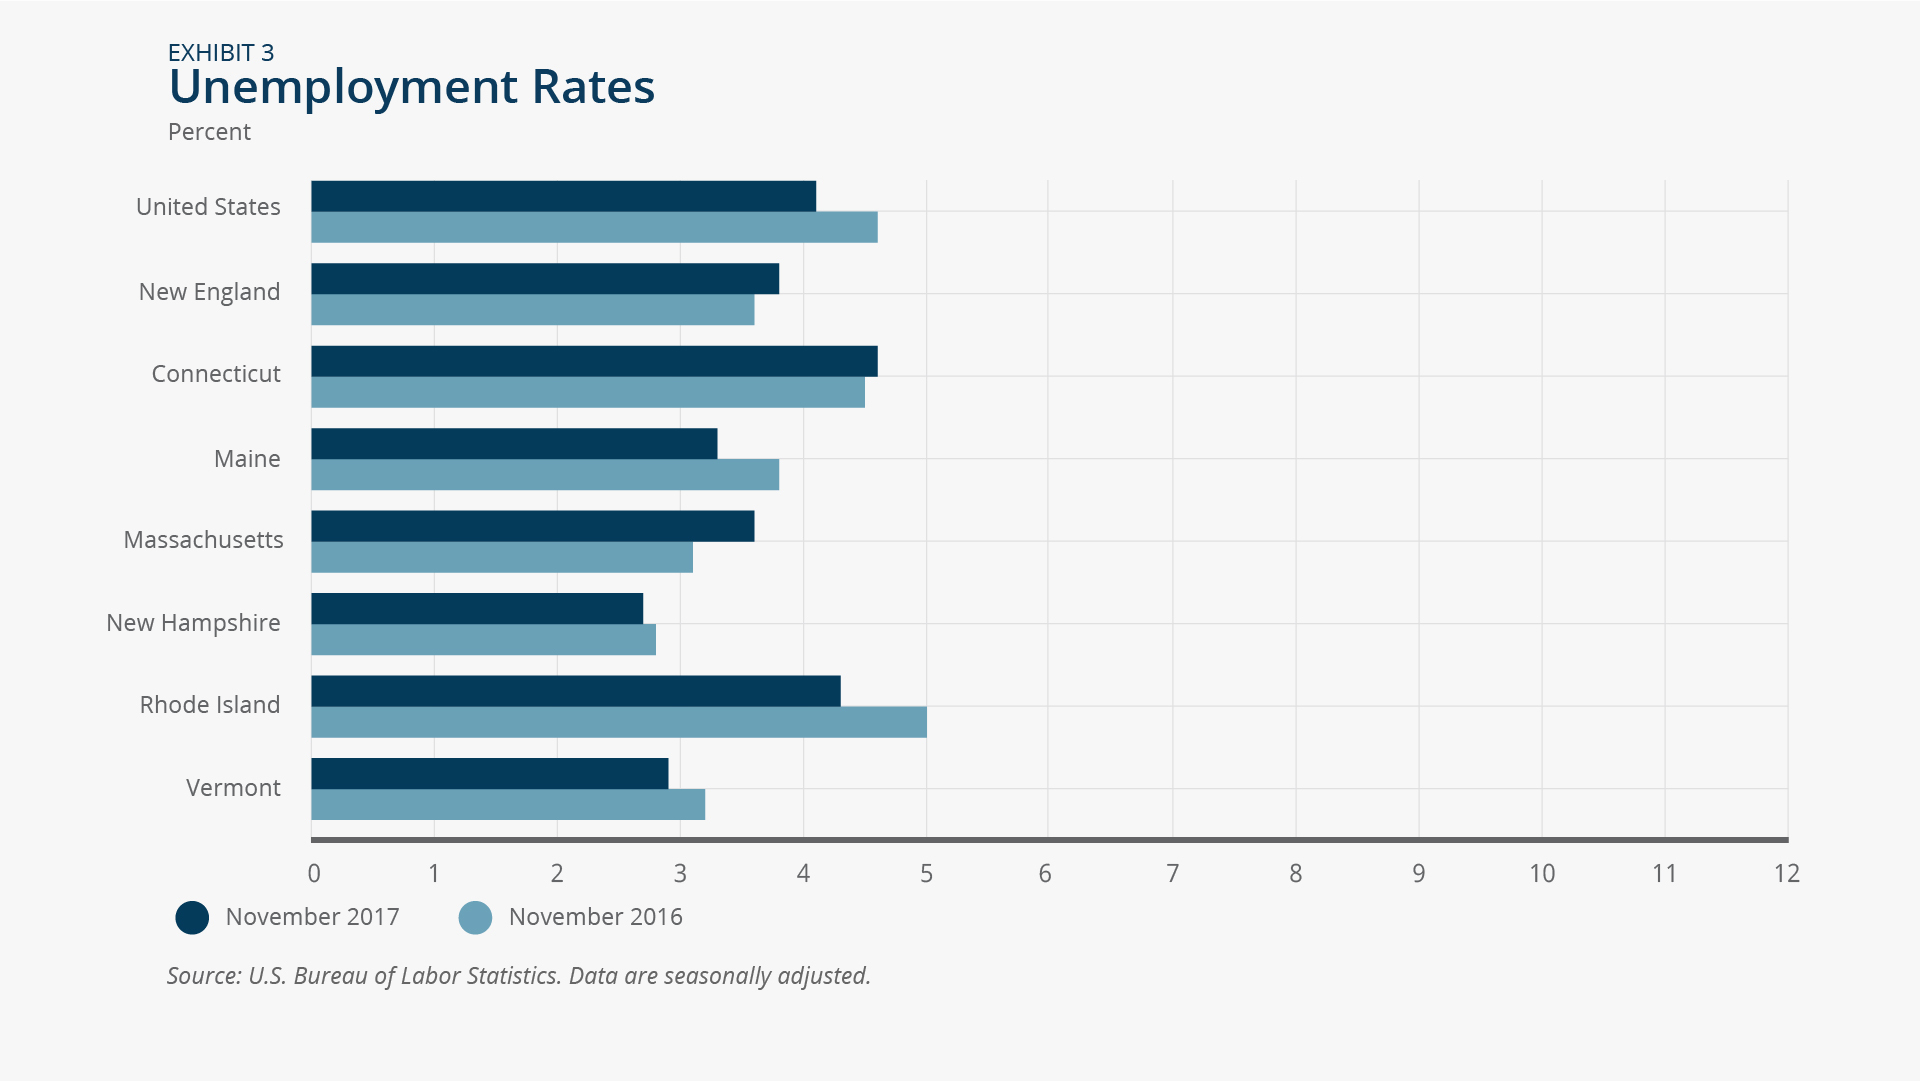
Four of the six New England states saw unemployment rate declines between November 2016 and November 2017, with the exception of Massachusetts and Connecticut, which experienced increases of 0.5 and 0.1 percentage points, respectively (Exhibit 3). However, the unemployment increase in Massachusetts can be attributed largely to a significant increase in the state’s labor force participation rate, a development which signals a healthy labor market rather than a deteriorating one. Considering the region as a whole, the unemployment rate increased 0.2 percentage points over the year, to land at 3.8 percent. The regional unemployment rate is up from a low of 3.6 percent in January 2017, but down from 4.1 percent in July 2017. New Hampshire retained the lowest unemployment rate in the region (2.7 percent) followed by Vermont at 2.9 percent. Connecticut (4.6 percent) and Rhode Island (4.3 percent) are the two states in the region with an unemployment rate as of November 2017 that exceeds the national rate (4.1 percent). Rhode Island experienced the steepest unemployment rate decline among New England states (0.7 percentage points).
Consumer Prices
Rising Fuel & Utilities costs contribute to regional consumer price growth
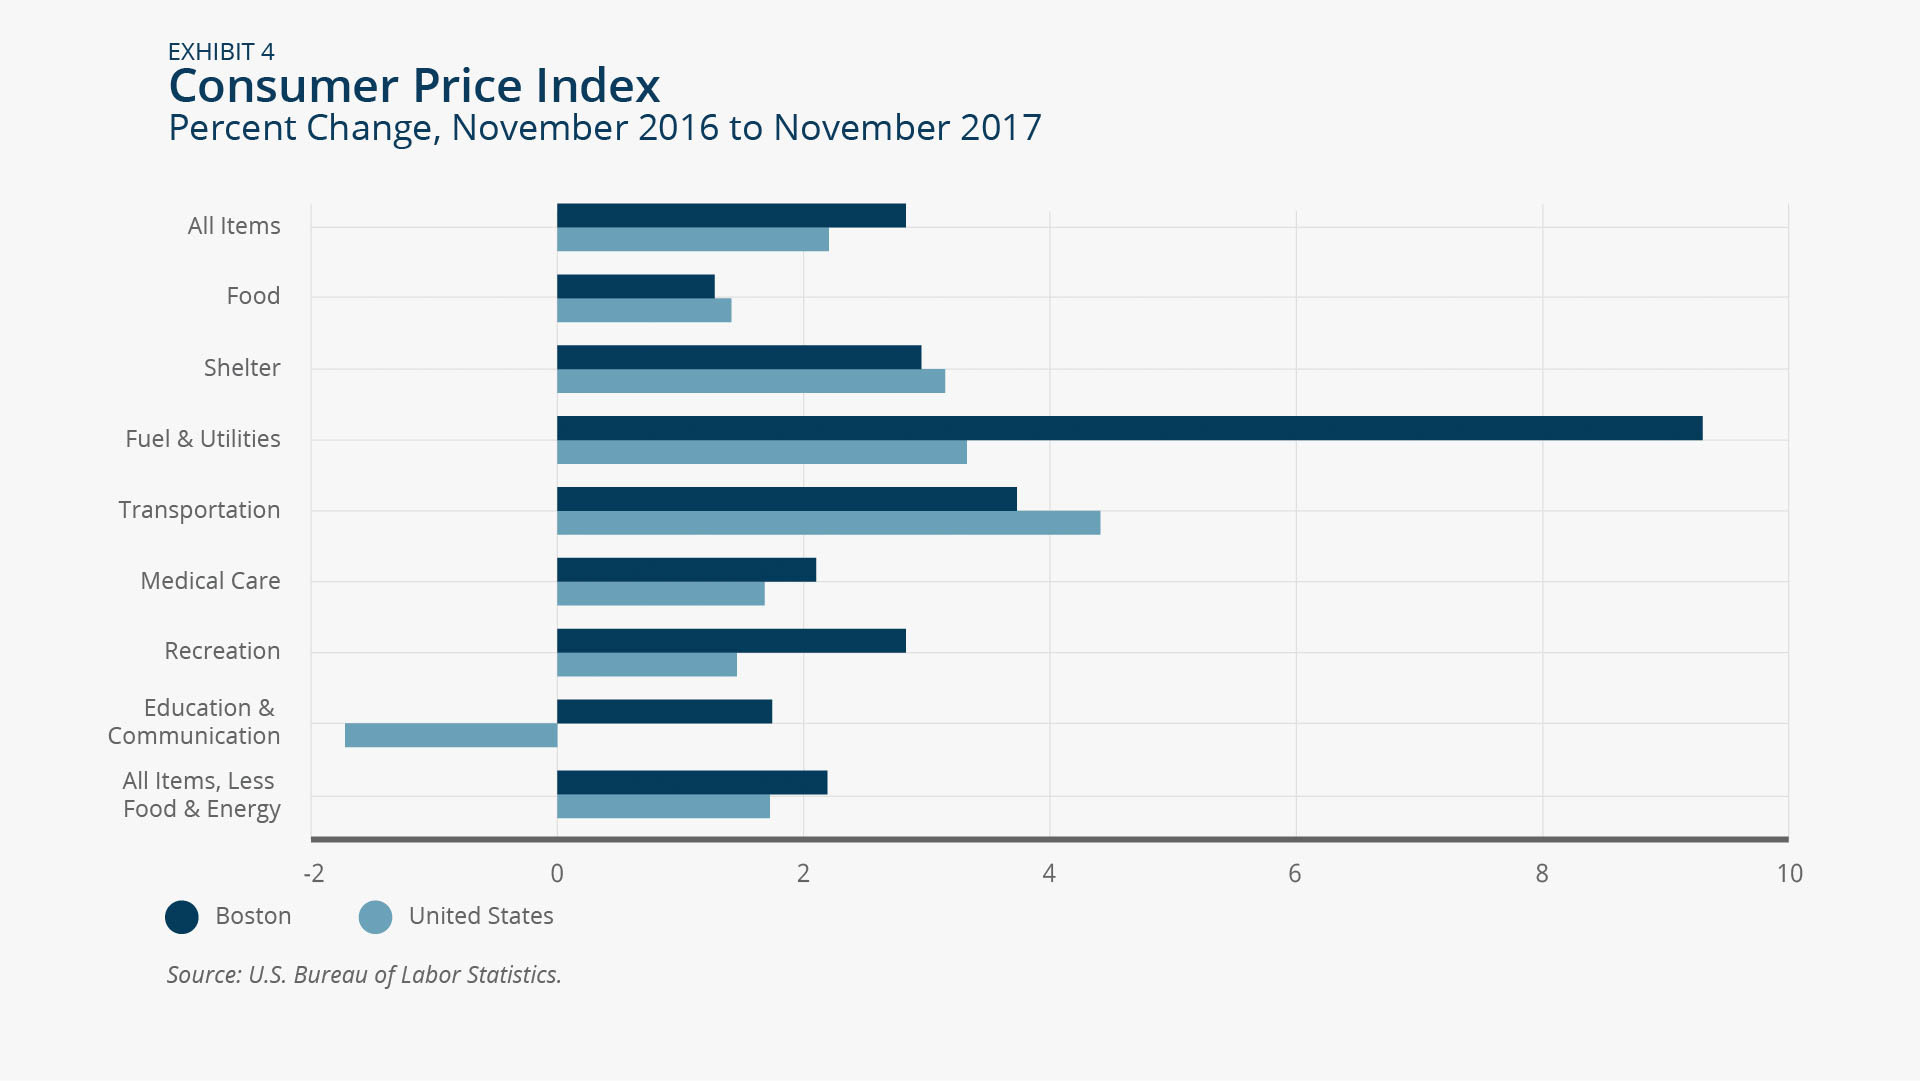
Consumer prices grew at a moderate pace in 2017, although at a slightly faster pace in the Boston area than in the United States as a whole (Exhibit 4). In the Boston area, consumer price inflation was 2.8 percent between November 2016 and November 2017, while for the same period consumer prices increased 2.2 percent nationwide. The recent price growth in the region was partially driven by a sharp increase (9.3 percent year-over-year) in Fuel & Utilities prices. For the United States, Fuel & Utilities prices increased at the more moderate pace of 3.3 percent over-the-year to November 2017. Education and Communication prices decreased nationally (1.7 percent year-over-year), but in the Boston area this sector experienced an increase in prices of 1.7 percent over the same period.
Home Prices
Rhode Island records fastest house price growth in the region
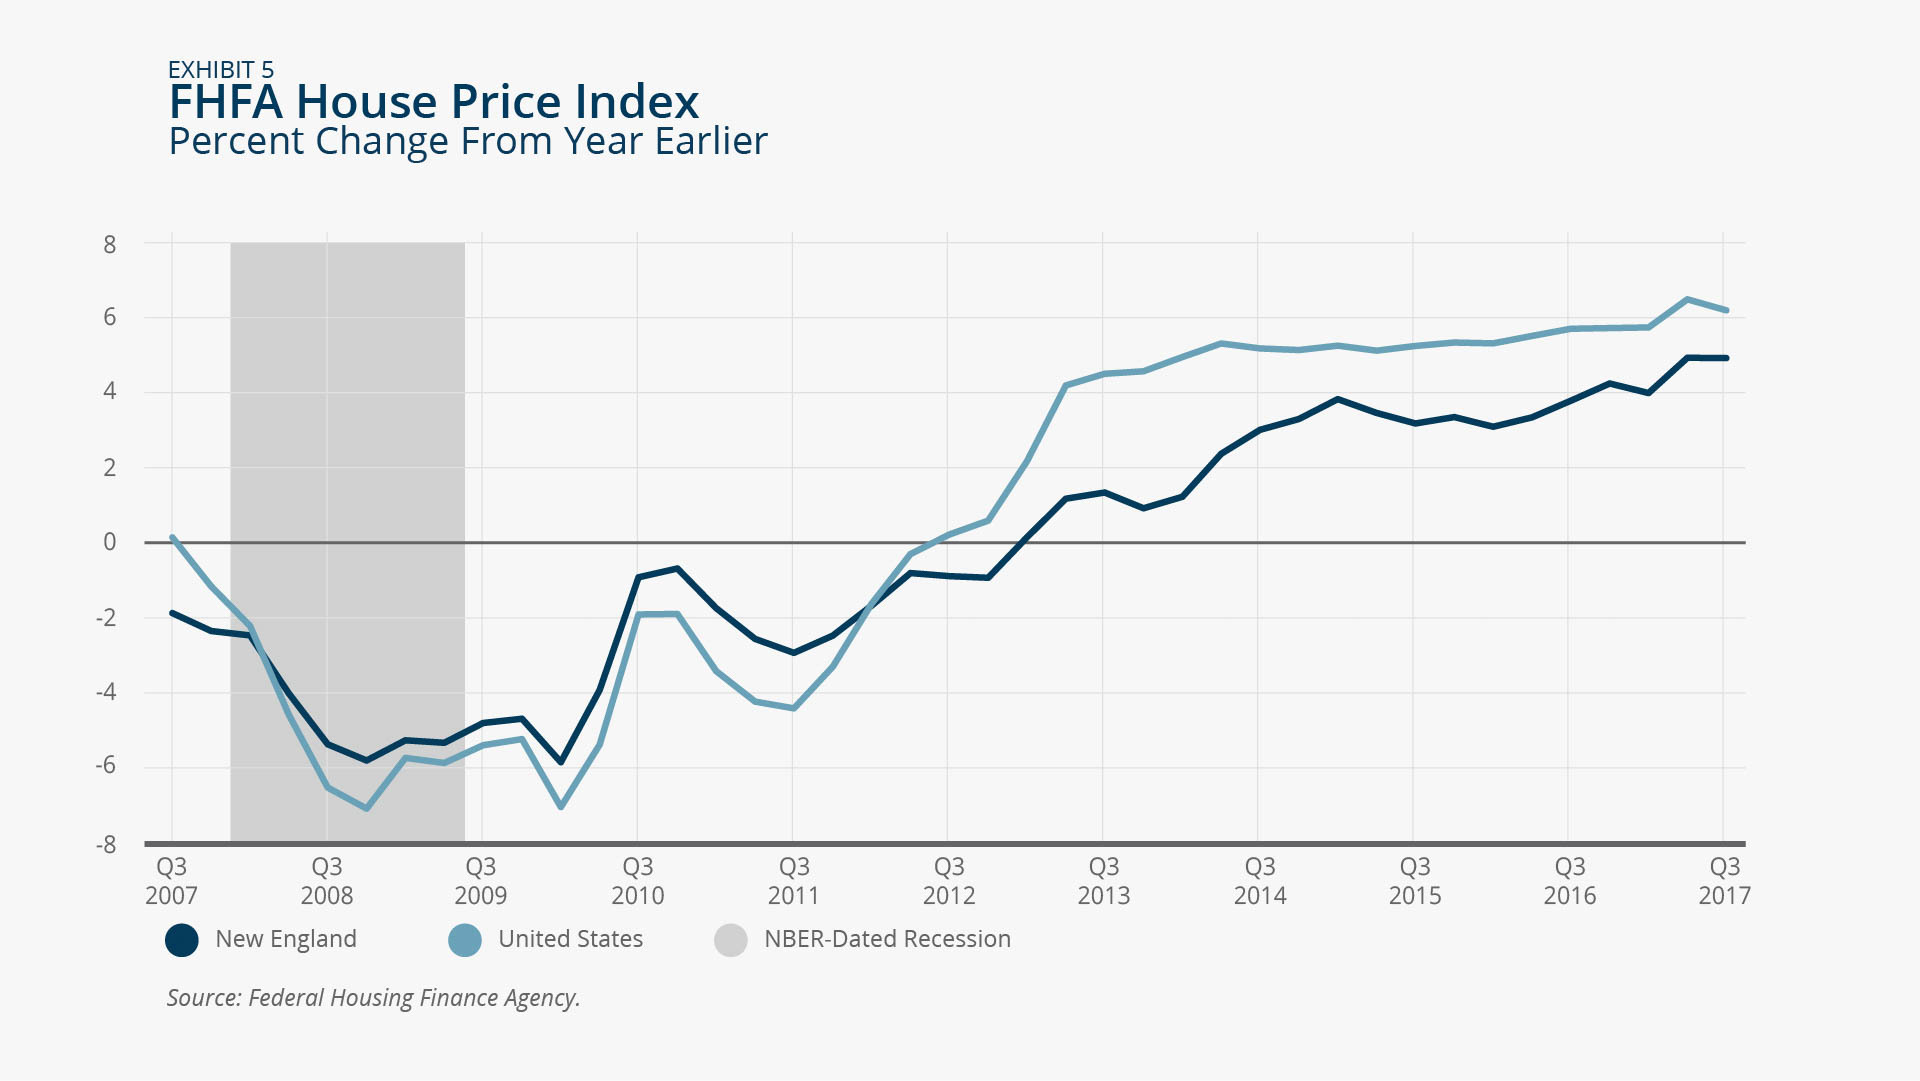
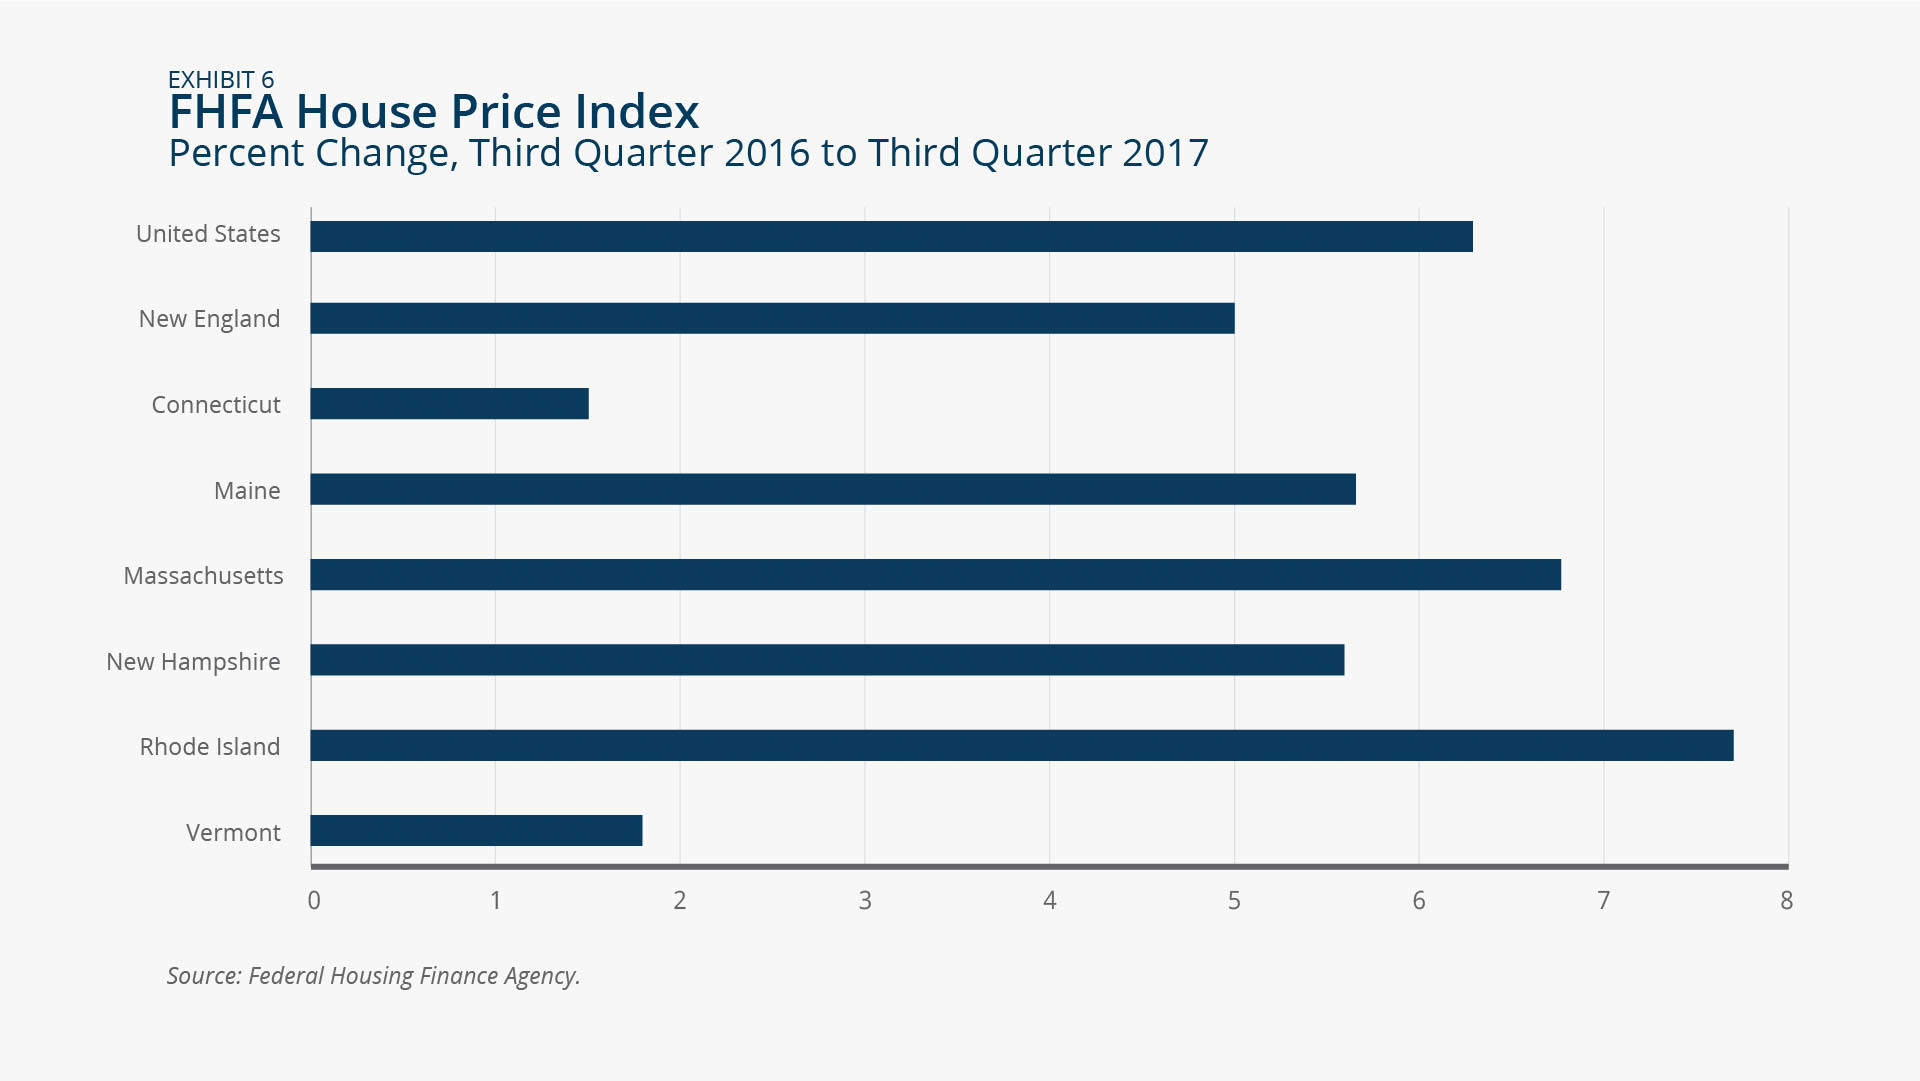
Home prices continued to rise both nationally and regionally, with national growth rates continuing to exceed regional rates (Exhibit 5). Between Q3 2016 and Q3 2017, home prices increased 6.3 percent nationally and 5.0 percent regionally. All six New England states reported positive house price growth year-over-year (Exhibit 6), but outside of Massachusetts (6.8 percent) and Rhode Island (7.7 percent), these gains trailed the national growth rate. House price growth in Connecticut was the lowest in the region over the same period, at 1.5 percent.

 About the Authors
Riley Sullivan,
Federal Reserve Bank of Boston
Riley Sullivan is a senior policy analyst with the New England Public Policy Center in the Federal Reserve Bank of Boston Research Department.
Email: riley.sullivan@bos.frb.org