Evictions in New England and the Impact of Public Policy during the COVID-19 Pandemic 


| Key Facts | |
 |
The eviction rate in New England declined 58% in 2020 and 43% in 2021 compared with the average rate for the 2017-2019 period. |
 |
In 2021, eviction rates declined 31% in non-metro area counties, less than 34% to 47% decline in metro area counties. |
 |
78% to 87% of ERA spending in New England has gone toward covering rent arrears and future rent payments. |
 |
|
To stave off a flood of evictions during the COVID-19 pandemic, which was the feared outcome when millions of renting households were suddenly unemployed, Congress and many states implemented policies that included eviction moratoriums and federally funded rental-assistance programs. These programs succeeded in keeping millions of renters housed and driving eviction rates down in the early months of the pandemic. The number of evictions filed in New England declined 56 percent in 2020 and 39 percent in 2021 compared with the average number of evictions filed annually from 2017 through 2019—the pre-pandemic period. Recently, new fears have arisen that many renters remain financially unstable from the pandemic and that a dramatic increase in the number of evictions will follow the end of rental-assistance programs. Based on data from three New England states, it is not clear that these fears will be realized. Evictions rose modestly following the end of these programs in Massachusetts and Rhode Island but stayed below pre-pandemic levels. While in Connecticut, evictions spiked sharply once programs ended and remain slightly above pre-pandemic levels.
Sign up for new research and data on the New England economy.
I. Eviction-filing Trends and the Effect of Moratoriums
From the start of the COVID-19 crisis, policymakers and housing advocates raised concerns that the pandemic’s economic toll could lead to a dramatic increase in evictions among renter households in the United States. These concerns were valid. The financial security of renter households, both nationally and in New England, appeared precarious for much of 2020 and 2021. Unemployment reached multi-decade highs in 2020, and an estimated 36 percent of renter households nationally were likely to miss a housing payment because of a COVID-19–related job loss.1 In December 2020, according to the U.S Census Bureau’s Household Pulse Survey (HPS), 19 percent of renter households nationally and 17 percent in New England were behind on rent payments.2
This report uses court-record data for the six New England states to highlight how the number of evictions changed in the region during 2020 and 2021, which areas experienced the most evictions, and in which places the number remained high despite support for renters from policymakers. Regional data for this report were obtained from information requests to state judiciaries, housing-finance and legal-aid organizations, and public reports available on state judiciary websites. The box below, “Eviction-data Summary,” provides a fuller description of the eviction data used in this report.
Table 1: Eviction Filings per 100 Renter Households
By state in New England, 2017–2021
| State | 2017–2019 Annual Average | 2020 | 2021 |
| CT | 4.3 | 1.4 | 2.0 |
| ME | 3.6 | 2.0 | 2.5 |
| MA | 3.9 | 1.5 | 2.3 |
| NH | 4.2 | 2.4 | 2.5 |
| RI | 5.1 | 2.9 | 3.3 |
| VT | 2.3 | 1.0 | 1.4 |
| Note(s): Eviction rates are calculated as the number of eviction filings per 100 renter households. Source(s): New England state eviction-filing data. American Community Survey 5-year estimates for 2019 and 2020. |
|||
Despite the fears of many, New England experienced far fewer evictions in 2020 and 2021 than at any point in the available data. Table 1 shows the eviction rate—the number of filings per 100 renter households—for each New England state. The eviction rate in New England was 58 percent lower in 2020 and 43 percent lower in 2021 compared with the annual average rate for 2017 through 2019.3 Among the New England states, eviction rates declined the most in Connecticut and Massachusetts, falling 53 percent and 41 percent, respectively. Maine saw the smallest decline, 31 percent. Nationally, the eviction rate was 57 percent lower in 2020 and 51 percent lower in 2021 compared with the 2016 rate.4
Eviction-data Summary
Table 2 provides an overview of eviction data obtained for this report. For each New England state, the number of eviction filings reflects when a landlord filed a notice to quit with the local court district and the tenant, informing both of their intention to begin the eviction process. Data for northern New England were available at the county level, whereas data for southern New England were available at the city or town level. There are several types of evictions. The most common is for nonpayment of rent, defined as missing at least one monthly rent payment. For-cause evictions involve the destruction of property or the conducting of illegal activity in the housing unit. A no-cause eviction occurs when a landlord seeks to terminate a lease before it expires or when a tenant remains in the unit beyond the end of the lease. Data on eviction types were available for Massachusetts and Rhode Island only. In Massachusetts, evictions are designated as nonpayment, for cause, no cause, or other. In Rhode Island, they are designated as nine-day evictions (for nonpayment of rent only) or 20-day evictions (for all other reasons). When possible, this report’s eviction-filing estimates exclude commercial-property evictions. The execution of an eviction occurs when the landlord takes possession of the housing unit by court order. Data on such court orders were available for Connecticut, New Hampshire, and Rhode Island only.
Table 2: New England State Eviction Data Summary
| State | Geography | Frequency | Period | Filings | Type | Outcome |
| CT | Address | Daily | 2017–2022 | Y | N | Y |
| ME | County | Monthly | 2007–2021 | Y | N | N |
| MA | Zip code | Weekly | 2016–2022 | Y | Y | N |
| NH | County | Weekly | 2019–2022 | Y | N | Y |
| RI | Address | Daily | 2015–2022 | Y | Y | Y |
| VT | County | Daily | 2015–2021 | Y | N | N |
Eviction filings capture only instances when a landlord seeks to remove a tenant from a unit for nonpayment of rent or other lease violations using the court system. They do not capture non-judicial options, such as when a tenant and landlord mutually agree to end a lease without repayment of rental arrears to avoid a lengthy court process. Eviction filings also do not represent the total number of renter households that are behind on rent, which is almost certainly higher than the number of filings. As shown in Section 3, in the states where such data were available, the number of households with unpaid rent that applied for assistance from federally funded Emergency Rental Assistance (ERA) programs in 2021 exceeded the number of evictions filed, indicating that more households are behind on rent than eviction-filing data suggest.

Federal Reserve Bank of Boston
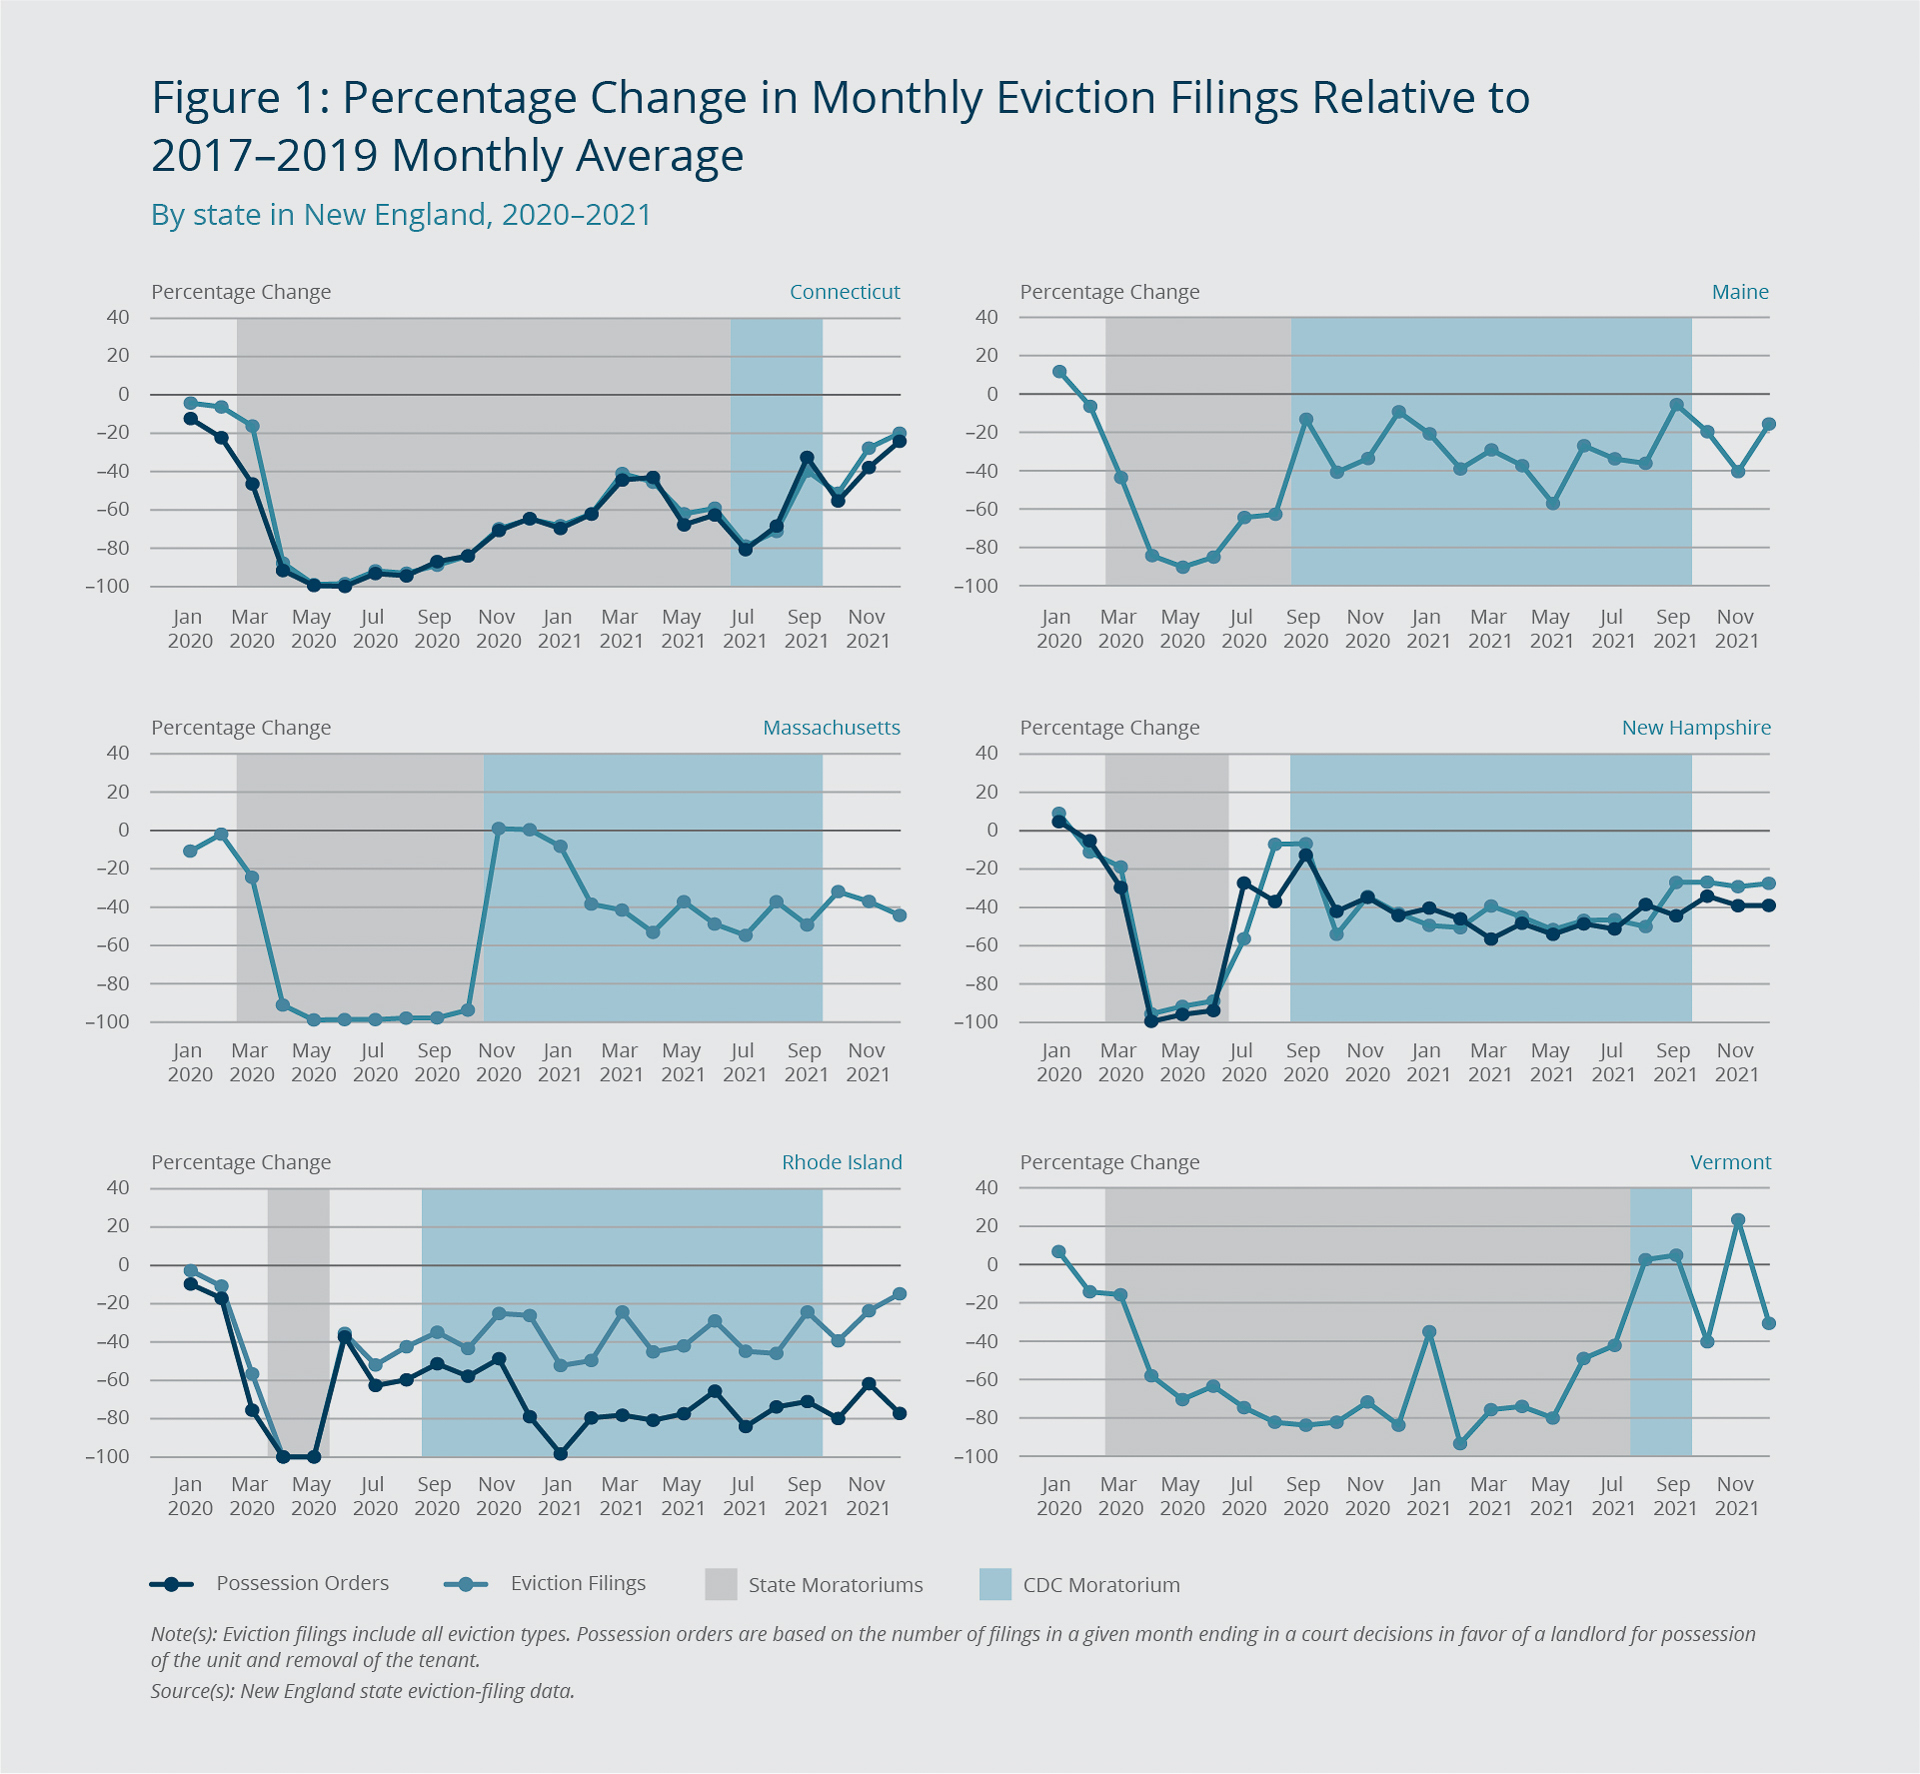
State eviction moratoriums appear to have dramatically reduced the number of eviction filings in every New England state in 2020 and 2021. Figure 1 shows the percentage change in the number of evictions filed per month in 2020 and 2021 compared with the average number for that month during the 2017–2019 period. The gray area indicates the period when that state’s eviction moratorium was in place. State moratoriums were either effective bans on non-emergency eviction hearings due to court office closures or direct bans on filing non-emergency evictions through gubernatorial executive order or legislative action.5 The moratoriums ranged in duration from two months in Rhode Island to 17 months in Vermont. The state moratoriums either postponed non-emergency eviction hearings or prevented the filing of non-emergency eviction cases altogether. Initially, non-emergency eviction cases always involved nonpayment of rent, but in Connecticut the moratorium was relaxed to allow the filing of an eviction when a large amount of rent went unpaid.6
Eviction filings in New England fell to their lowest level during the pandemic in May 2020, when fewer than 200 evictions were filed in the entire region. In Massachusetts and Rhode Island, the number of evictions filed fell to essentially zero. In Maine, the supreme judicial court issued an order that prevented eviction cases from being scheduled or heard but did not prevent landlords from filing evictions. Nevertheless, eviction filings declined, possibly in part because renters were receiving financial support through the Coronavirus Aid, Relief, and Economic Security (CARES) Act and expanded unemployment insurance. Landlords also may have tried to remain flexible with tenants who were struggling financially during this period, or they may have been disincentivized from filing an eviction due to case backlogs stemming from court office closures.
Despite an overall decline in eviction filings in 2020 and 2021, there were months when New England states saw more eviction filings than in pre-pandemic years. These spikes tended to occur immediately after state moratoriums expired. In November 2020, the first full month after Massachusetts’s eviction moratorium expired, eviction filings in that state were 1 percent greater than the 2017–2019 average for that month. In New Hampshire, the number of eviction filings rose to just 7 percent less than the pre-pandemic levels two months after the expiration of the state’s eviction moratorium. Eviction filings rose above pre-pandemic levels in Vermont in the months following the end of that state’s moratorium.
Table 3: Possession Orders as a Share of Total Eviction Filings
By state in New England, 2017–2021
| 2017–2019 | 2020 | 2021 | |
| Connecticut | 33.8 | 28.7 | 31.0 |
| New Hampshire | 63.6 | 63.4 | 59.2 |
| Rhode Island | 67.2 | 51.2 | 23.7 |
| Note(s): A possession order is defined as an eviction case ending in a court-ordered removal of the tenant from a unit and possession of the unit by the landlord. Data on possession orders were available only for Connecticut, New Hampshire, and Rhode Island. Source(s): New England state eviction-filing data. |
|||
In addition to the states enacting eviction moratoriums, the Centers for Disease Control and Prevention (CDC) issued its own moratorium in September 2020. However, the CDC moratorium does not appear to have affected the number of evictions filed in New England. The legality of the CDC moratorium was controversial, and enforcement of it varied dramatically across jurisdictions. Thus, the effect of this moratorium likely varied as well.7 The CDC moratorium was also distinctly different from state-level moratoriums in that it did not prohibit eviction filings or hearings but instead instructed judges to refrain from executing possession orders that would compel tenants to vacate apartments (after a ruling in favor of landlords in eviction cases).8 Thus, the CDC moratorium did not prevent landlords from filing eviction cases but instead provided a basis for judges to withhold possession orders. Even so, the CDC moratorium also does not appear to have affected the number of possession orders in at least two of the three New England states where data on such orders were available. As shown in Table 3 in Connecticut and New Hampshire, the shares of eviction orders that resulted in possession orders did not decrease substantially after the CDC moratorium began.
The number of possession orders did decline sharply in all three states—by 44 percent in New Hampshire, 84 percent in Connecticut, and 92 percent in Rhode Island—but this was largely because fewer eviction cases were filed. If the CDC moratorium had any impact on possession orders, it was in Rhode Island, the only New England state (with available data) where possession orders declined both overall and as a share of total filings. Thus, every eviction case filed in Rhode Island in 2020 and 2021 was less likely to end in a possession order relative to the 2017–2019 period.
However, even in Rhode Island, a variety of factors other than the CDC moratorium could have caused the decrease in possession orders. A backlog of cases in Rhode Island courts, for example, could have delayed hearings on eviction cases, which would have reduced the share resulting in possession orders. Greater coordination between the state’s courts and rental-assistance programs also could have made it easier to intervene in eviction cases and forestall those that would have ended in a renter household being removed from their apartment. Possession orders may have been averted in individual eviction cases due to the CDC moratorium, but overall, it does not appear to have played a role in reducing eviction rates or possession orders in New England. The region’s more restrictive state-level eviction moratoriums and financial support programs for renters were likely more important factors.
II. Eviction Rates and Community Characteristics
New England communities with higher annual eviction rates before the pandemic continued to see relatively higher rates during the pandemic, although the overall number of evictions in those communities decreased. In majority-minority communities, for example, eviction rates, on average, remained higher than those in non-Hispanic White communities.9 Eviction rates also remained elevated in areas where incomes were lower relative to local housing costs. The average eviction rate in 2021 was 15 percent higher in areas where half or more of renter households were housing-cost burdened (spending more than 30 percent of their household income on rent) compared with areas where less than half were housing-cost burdened.10 State moratoriums and financial-assistance programs likely dramatically reduced eviction rates in these eviction-prone communities, but the overall landscape of where evictions occurred in 2020 and 2021 looked much the same as it did before the pandemic.
Not surprisingly, more evictions are filed in densely populated metropolitan areas, where more renters live. However, after controlling for the number of renter households in an area, this report finds that smaller metropolitan and non-metropolitan counties in New England have eviction rates similar to or higher than larger metropolitan areas. This is likely because, even though these places generally have lower housing costs, renters experience comparable or higher rates of housing-cost burden stemming from lower household incomes.11 Table 4 shows the average eviction rates in large, medium-sized, and small metro-area counties as well as non-metro-area counties in each New England state. Large metro areas are defined as those with populations of more than 1 million people; medium-sized metro areas are those with 250,000 to 1 million people; and small metro areas are those with fewer than 250,000 people.12
Table 4: Average Eviction Filing Rate by Metropolitan Area
By state in New England, 2017–2021
| 2017–2019 annual Average | CT | MA | ME | NH | VT |
| Large metro areas | 4.4 | 3.5 | - | 3.7 | - |
| Medium-sized metro areas | 4.3 | 5.1 | 3.0 | 4.7 | - |
| Small metro areas | - | 4.8 | 4.9 | n/a | 1.8 |
| Non-metro areas | 3.3 | 3.5 | 3.5 | 4.1 | 2.6 |
| 2020 | |||||
| Large metro areas | 1.4 | 1.4 | - | 2.0 | - |
| Medium-sized metro areas | 1.3 | 1.9 | 1.5 | 2.8 | - |
| Small metro areas | - | 1.8 | 2.5 | - | 0.8 |
| Non-metro areas | 1.2 | 1.1 | 2.1 | 2.4 | 1.1 |
| 2021 | |||||
| Large metro areas | 2.0 | 2.0 | - | 2.4 | - |
| Medium-sized metro areas | 1.9 | 3.1 | 1.8 | 2.7 | - |
| Small metro areas | - | 3.1 | 3.4 | - | 1.1 |
| Non-metro areas | 1.9 | 2.5 | 2.8 | 2.4 | 1.6 |
| Note(s): Eviction rates are calculated as the number of eviction filings per 100 renter households. Large metropolitan areas are defined as those with populations of more than 1 million people. Medium-sized metropolitan areas are defined as those with 250,000 to 1 million people. Small metropolitan areas are defined as those with fewer than 250,000 people. Source(s): New England state eviction-filing data, American Community Survey 5-year estimates for 2019 and 2020. |
|||||
In northern New England especially, eviction rates are often higher in less populated metro-area and non-metro-area counties. In Massachusetts, eviction rates also tend to be lower in large metro areas compared with less populated areas. Connecticut is the exception. Both before and during the pandemic, eviction rates in this state were highest in large metro-area counties. It is not possible to make these comparisons for Rhode Island because all of the state’s counties are part of large metropolitan areas.
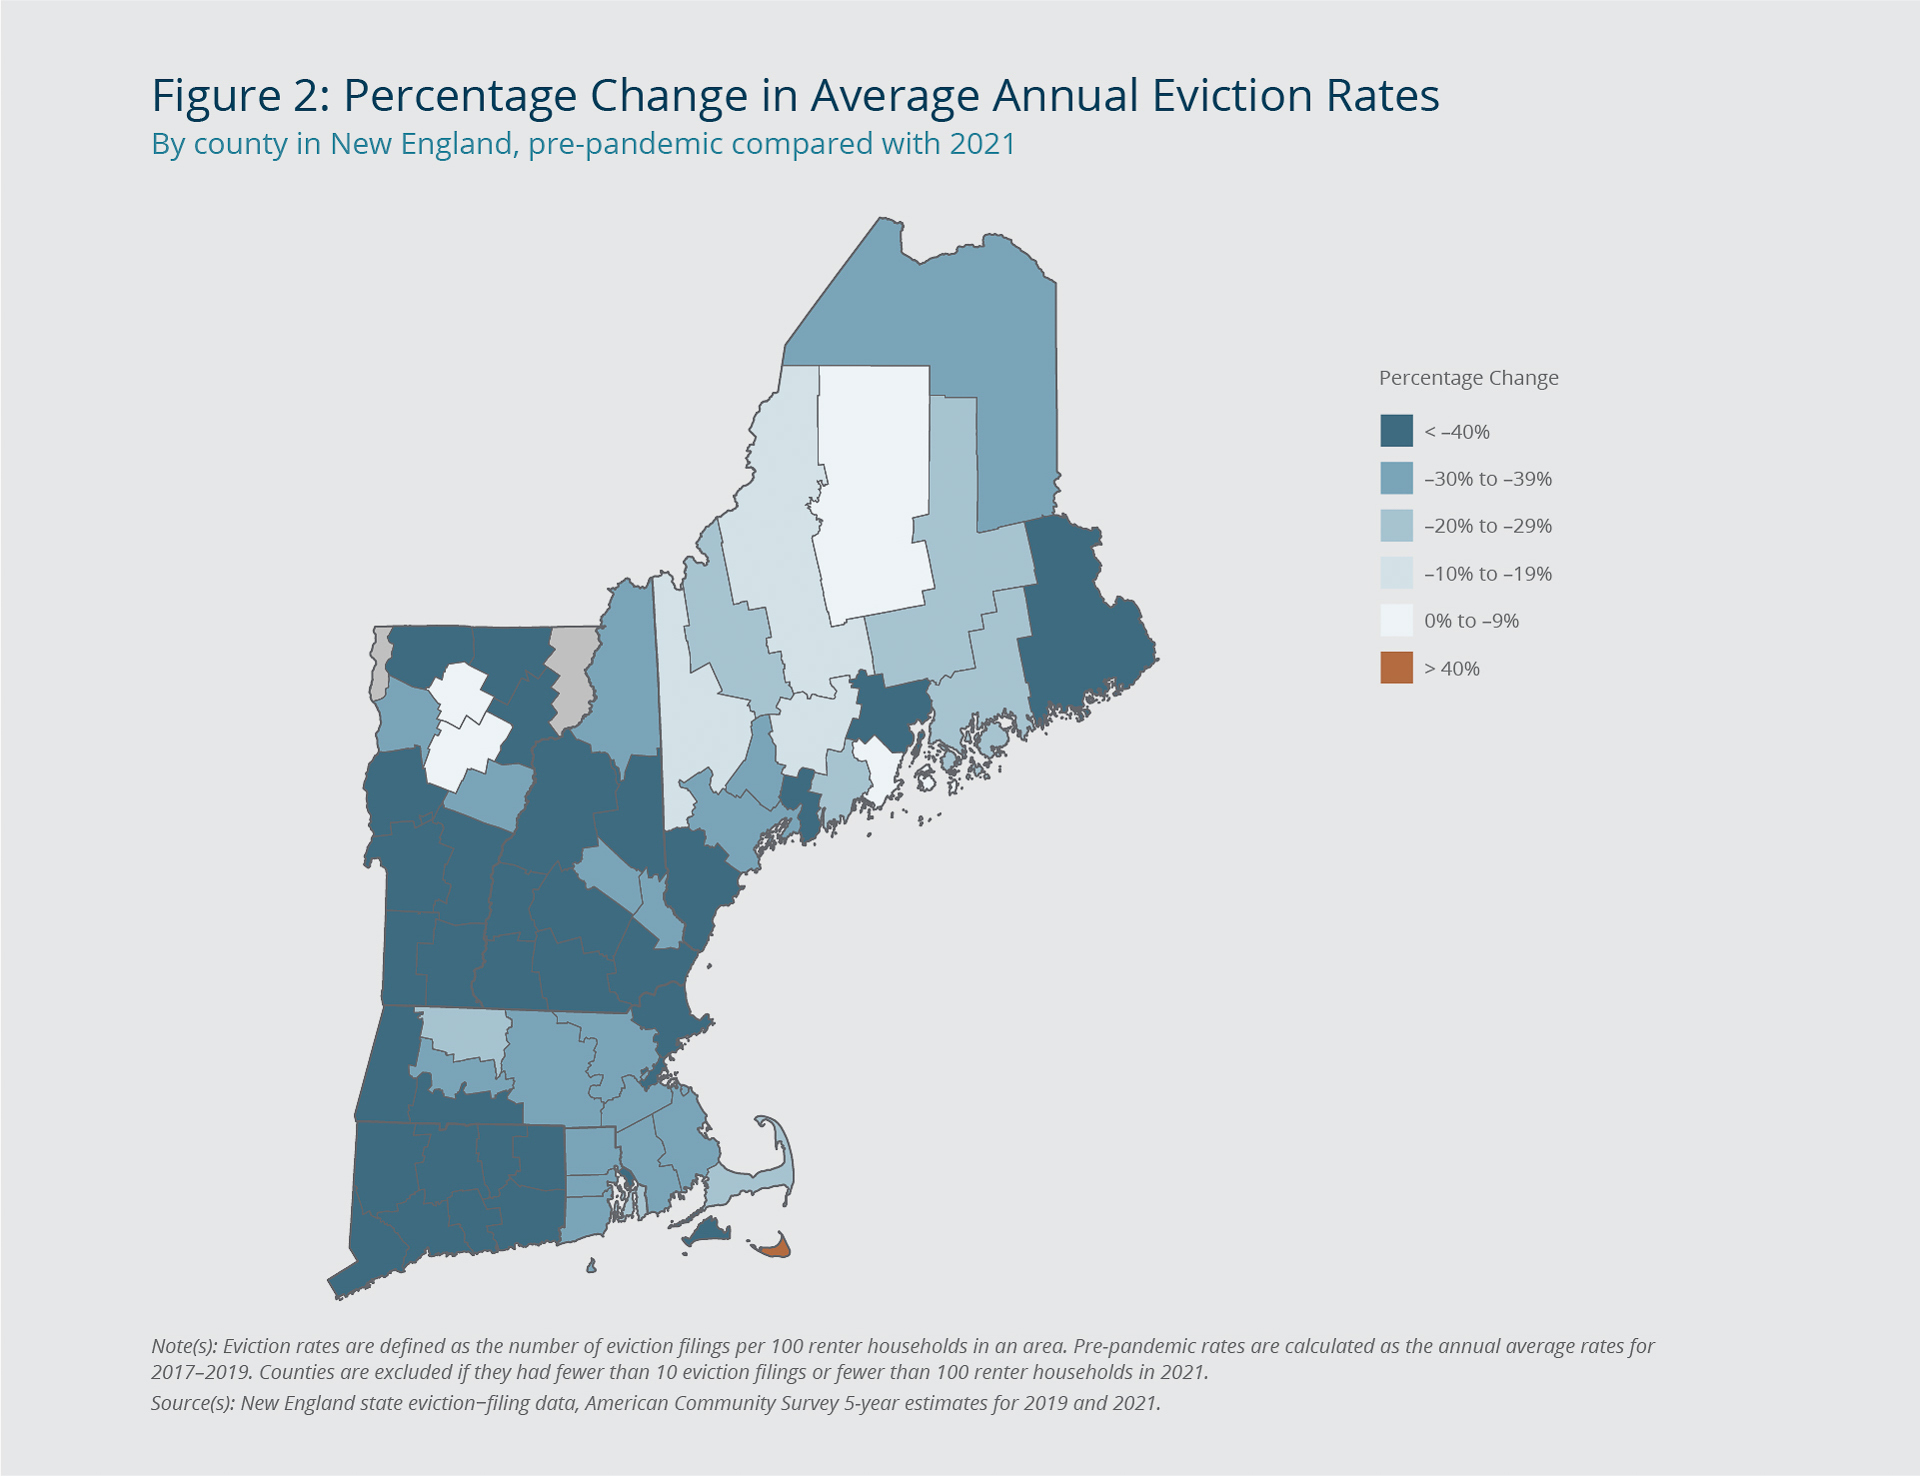
Along with having higher eviction rates generally, small metro-area and non-metro-area counties also saw smaller declines in eviction rates in 2021. Compared with the 2017–2019 average annual eviction rates, eviction rates in 2021 in New England declined 43 percent in large metro-area counties, 47 percent in medium-sized metro-area counites, 34 percent in small metro-area counties, and 31 percent in non-metro-area counties. While eviction rates declined throughout New England in 2020 and 2021, as Figure 2 shows, the overall decline in eviction rates at the county level varied considerably, particularly in northern New England, where the eviction rates of some counties remained close to their pre-pandemic levels. (Figure 2 excludes counties with fewer than 10 eviction filings in 2021 or fewer than 100 renter households in 2020.)
Federal Reserve Bank of Boston
In 2021, county-level eviction rates in southern New England were much further below their pre-pandemic levels compared with several counties in Maine and Vermont. In 2021, Knox and Piscataquis counties in Maine and Lamoille and Washington counties in Vermont all had eviction rates within 10 percent of their pre-pandemic averages. The rate in Vermont’s Washington County was less than 1 percent lower. Except for Washington County, the northern New England counties with 2021 eviction rates that were closest to their pre-pandemic levels have relatively small renter populations or very few eviction filings. Therefore, small differences in the number of filings can lead to dramatic percentage changes. In southern New England, eviction rates were closest to their pre-pandemic averages in Franklin (23.3 percent fewer evictions) and Barnstable (22.1 percent fewer evictions) counties in Massachusetts.13
Local economic effects of the pandemic, and differing rates of recovery, might explain some of the county-level variation in eviction-rate declines seen in Figure 2, but those factors do not appear to explain all of it. Having a higher average annual unemployment rate in 2020 is associated with having a higher eviction rate in 2021.14 Lamoille County in Vermont and Oxford County in Maine had the highest average annual unemployment rates in their respective states in 2020 and among the smallest declines in eviction rates in 2021.15 However, Hampden County in Massachusetts had the state’s highest rate of unemployment in 2020 and the largest eviction-rate decline in 2021. A slower recovery in unemployment from 2020 to 2021 also could have limited the decline in local eviction rates, as renters may have been out of work for longer and unable to make rent payments. Piscataquis and Somerset counties in Maine both saw their unemployment rates increase from 2020 to 2021, but so did Maine’s Washington County, which had that state’s largest eviction-rate decline.
Economic factors certainly impact residents’ financial stability; however, other factors likely also affected local eviction-rate declines in 2021. As noted in the previous section, state moratoriums varied across New England, and local enforcement of these moratoriums might have varied as well. Other factors include the size and scope of smaller rental-assistance programs that preceded the Emergency Rental Assistance (ERA) program. These include state programs supported by state and federal CARES Act funds ranging from $5 million in Maine to $100 million in Massachusetts.16 Maine’s state rental-assistance program was particularly small, covering only $1,000 of a household’s unpaid rent. Municipal rental-assistance programs also might have affected eviction-rate declines. Finally, the federally funded ERA program—and how well it was administered at the state level—likely influenced which parts of New England saw greater eviction-rate declines in 2020 and 2021.
III. The Impact of the Federal Emergency Rental Assistance Program
The largest source of financial assistance for renter households in 2021 came from the federally funded Emergency Rental Assistance (ERA) program. Each of the New England states received $352 million to $893 million in ERA funding through two separate federal appropriations acts. Due to minimum state allocations in the two acts, states with smaller populations received larger ERA allocations relative to their size. In New England, total ERA allocations averaged from about $800 per eligible renter household in Massachusetts to $4,250 per eligible renter household in Vermont.17
ERA program guidelines restrict eligibility to low-income renter households, defined as those with incomes at or below 80 percent of the area median income (AMI). Guidelines allow states to use ERA funds to cover various housing-related expenses other than rent, such as utility and moving expenses.18 However, most of the ERA spending among the New England states has covered rental arrears, rental stipends, first and last months’ rent, and security deposits. From 78 to 87 percent of ERA spending in New England has gone toward covering rent-related expenses. Non-arrearage rental expenses have comprised a large component of ERA spending, accounting for about 51 percent in Maine, 46 percent in Vermont, and about 32 percent in both Massachusetts and Rhode Island. No data were available for New Hampshire on the breakout of ERA spending on arrears versus non-arrearage rental expenses.19 By June 2022, all three southern New England states had stopped accepting new ERA applications. In northern New England, Maine stopped accepting new applications at the end of September 2022; New Hampshire stopped accepting new applications in October 2022; Vermont stopped accepting new applications at the end of November 2022 and restricted rental-assistance payments to households with low incomes.
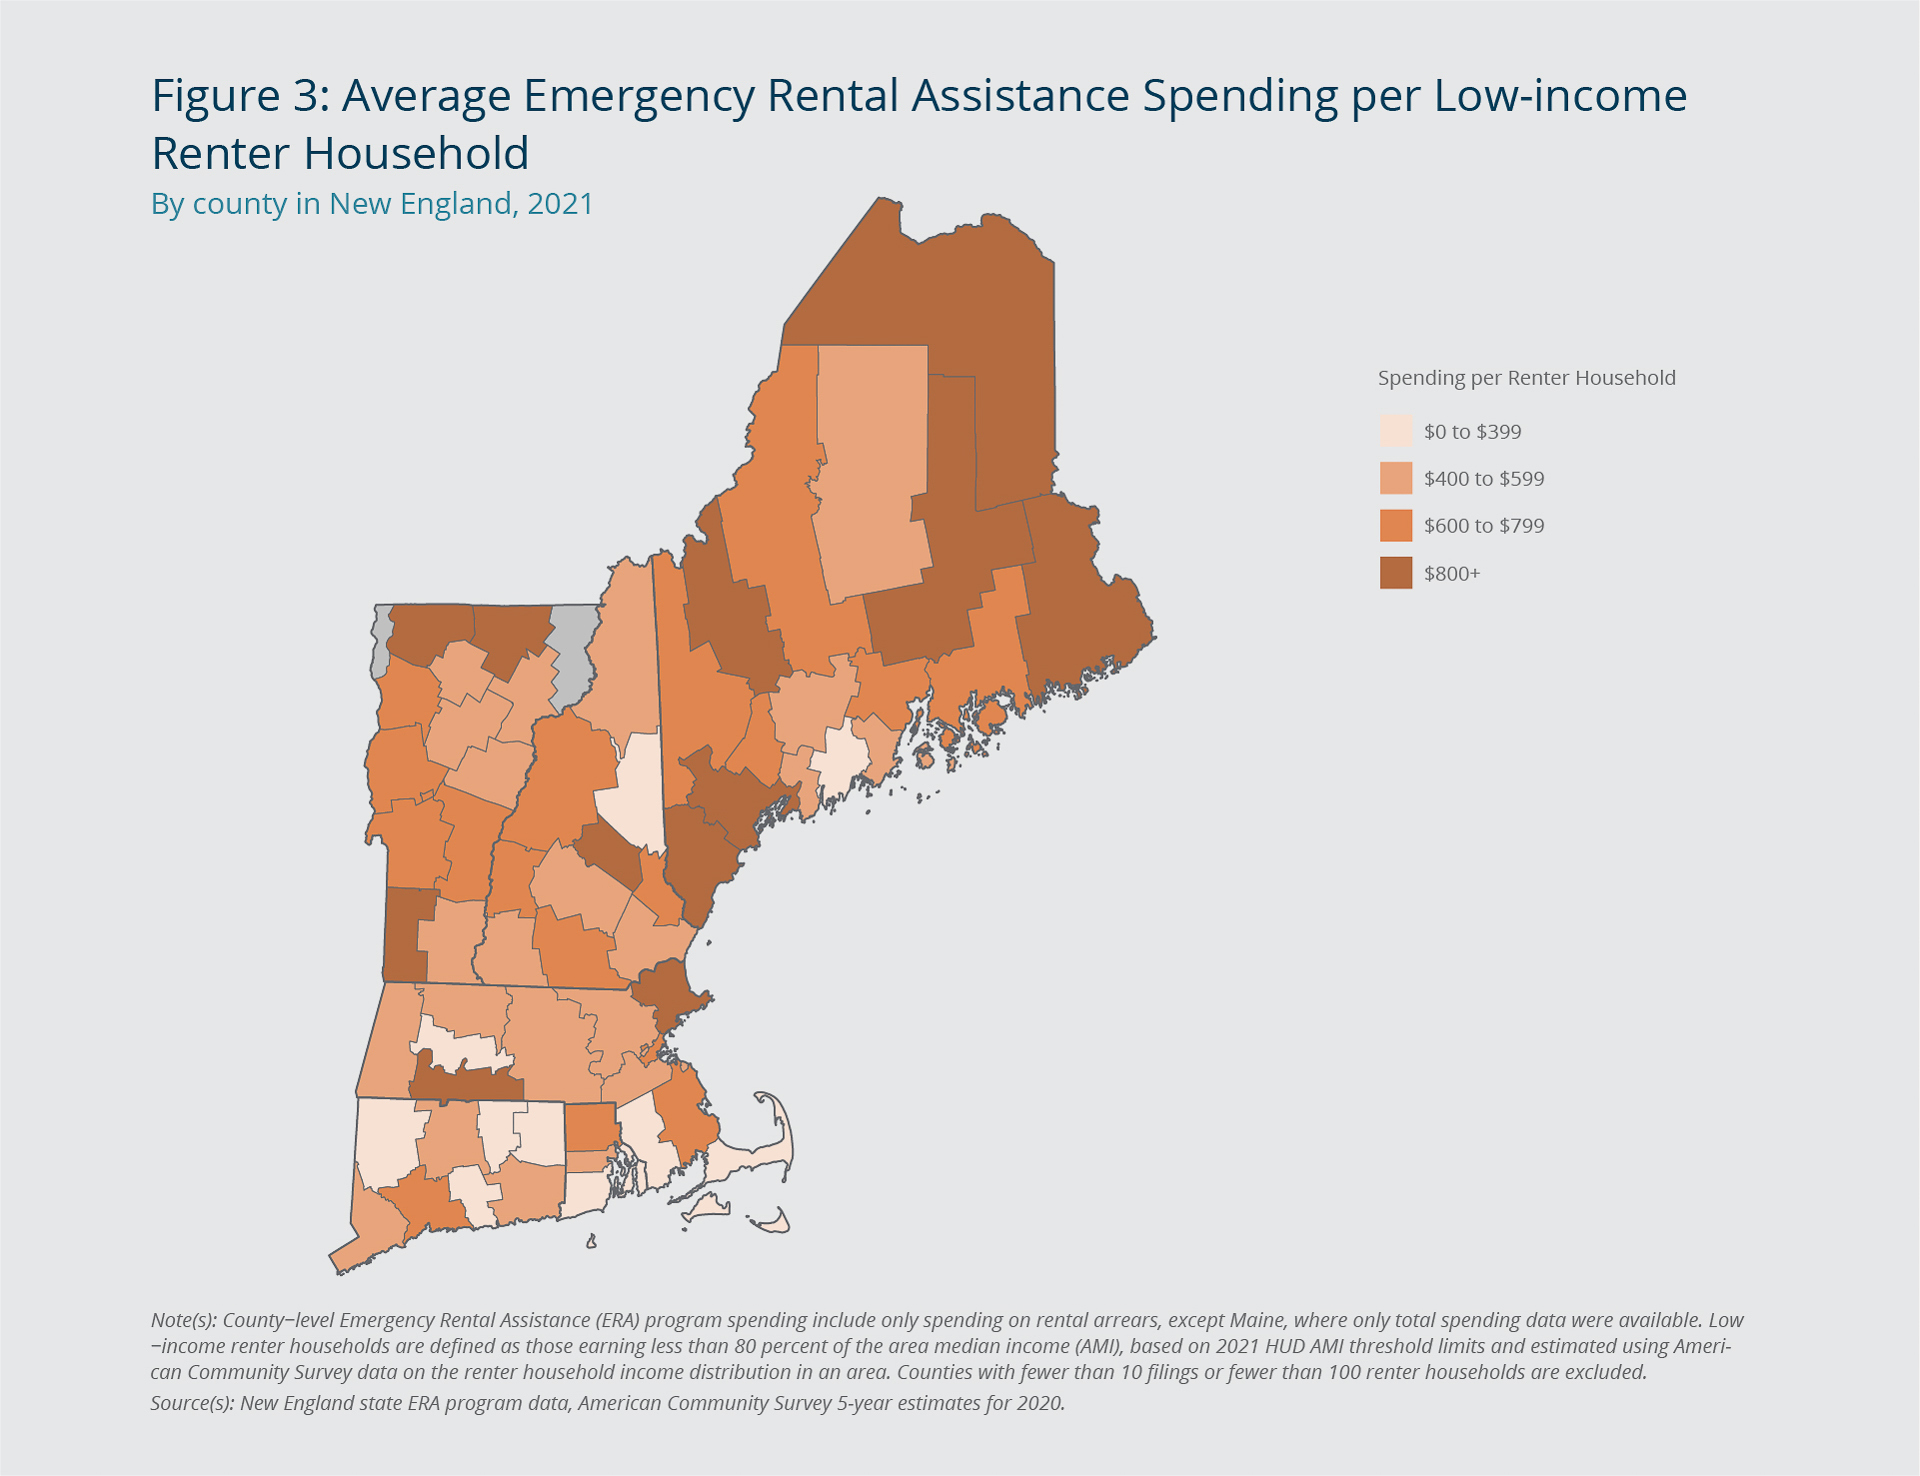
Estimating the full causal effect that the ERA program had on reducing eviction rates in 2021 is beyond the scope of this report, and it is confounded by the economic recovery and the variety of policy interventions put in place during the pandemic. In general, however, a larger amount of local ERA spending per low-income renter household is associated with a greater decline in eviction rates in 2021 compared with an area’s pre-pandemic (2017–2019) annual average.20 As shown in Figure 3, several of the New England counties with the smallest declines in eviction rates in 2021 compared with their pre-pandemic annual averages (shown in Figure 2) also spent comparatively fewer ERA dollars per low-income renter household. Lamoille and Washington counties in Vermont, for example, had the smallest declines in eviction rates in the state and spent the least amount of ERA funding, $438 and $478 per low-income renter household, respectively. Piscataquis and Knox counties in Maine had the smallest eviction-rate declines in that state; Piscataquis spent the lowest amount of ERA funding per low-income renter household in the state, and Knox County spent the fourth lowest amount. Barnstable and Bristol counties in Massachusetts both spent less than $400 in ERA funding per low-income renter household, and their eviction-rate declines in 2021 were among the state’s smallest. While some counties that spent comparatively little ERA funding had smaller declines in eviction rates, there are examples of greater spending and smaller declines. Franklin County in Massachusetts, for example, saw eviction rates decline by less than 30 percent in 2021 but spent more than $500 per low-income renter household in ERA funding. In Maine’s Penobscot County, the eviction rate also declined by less than 30 percent, but the county spent the most ERA money per low-income renter household in the state, $932.
Federal Reserve Bank of Boston
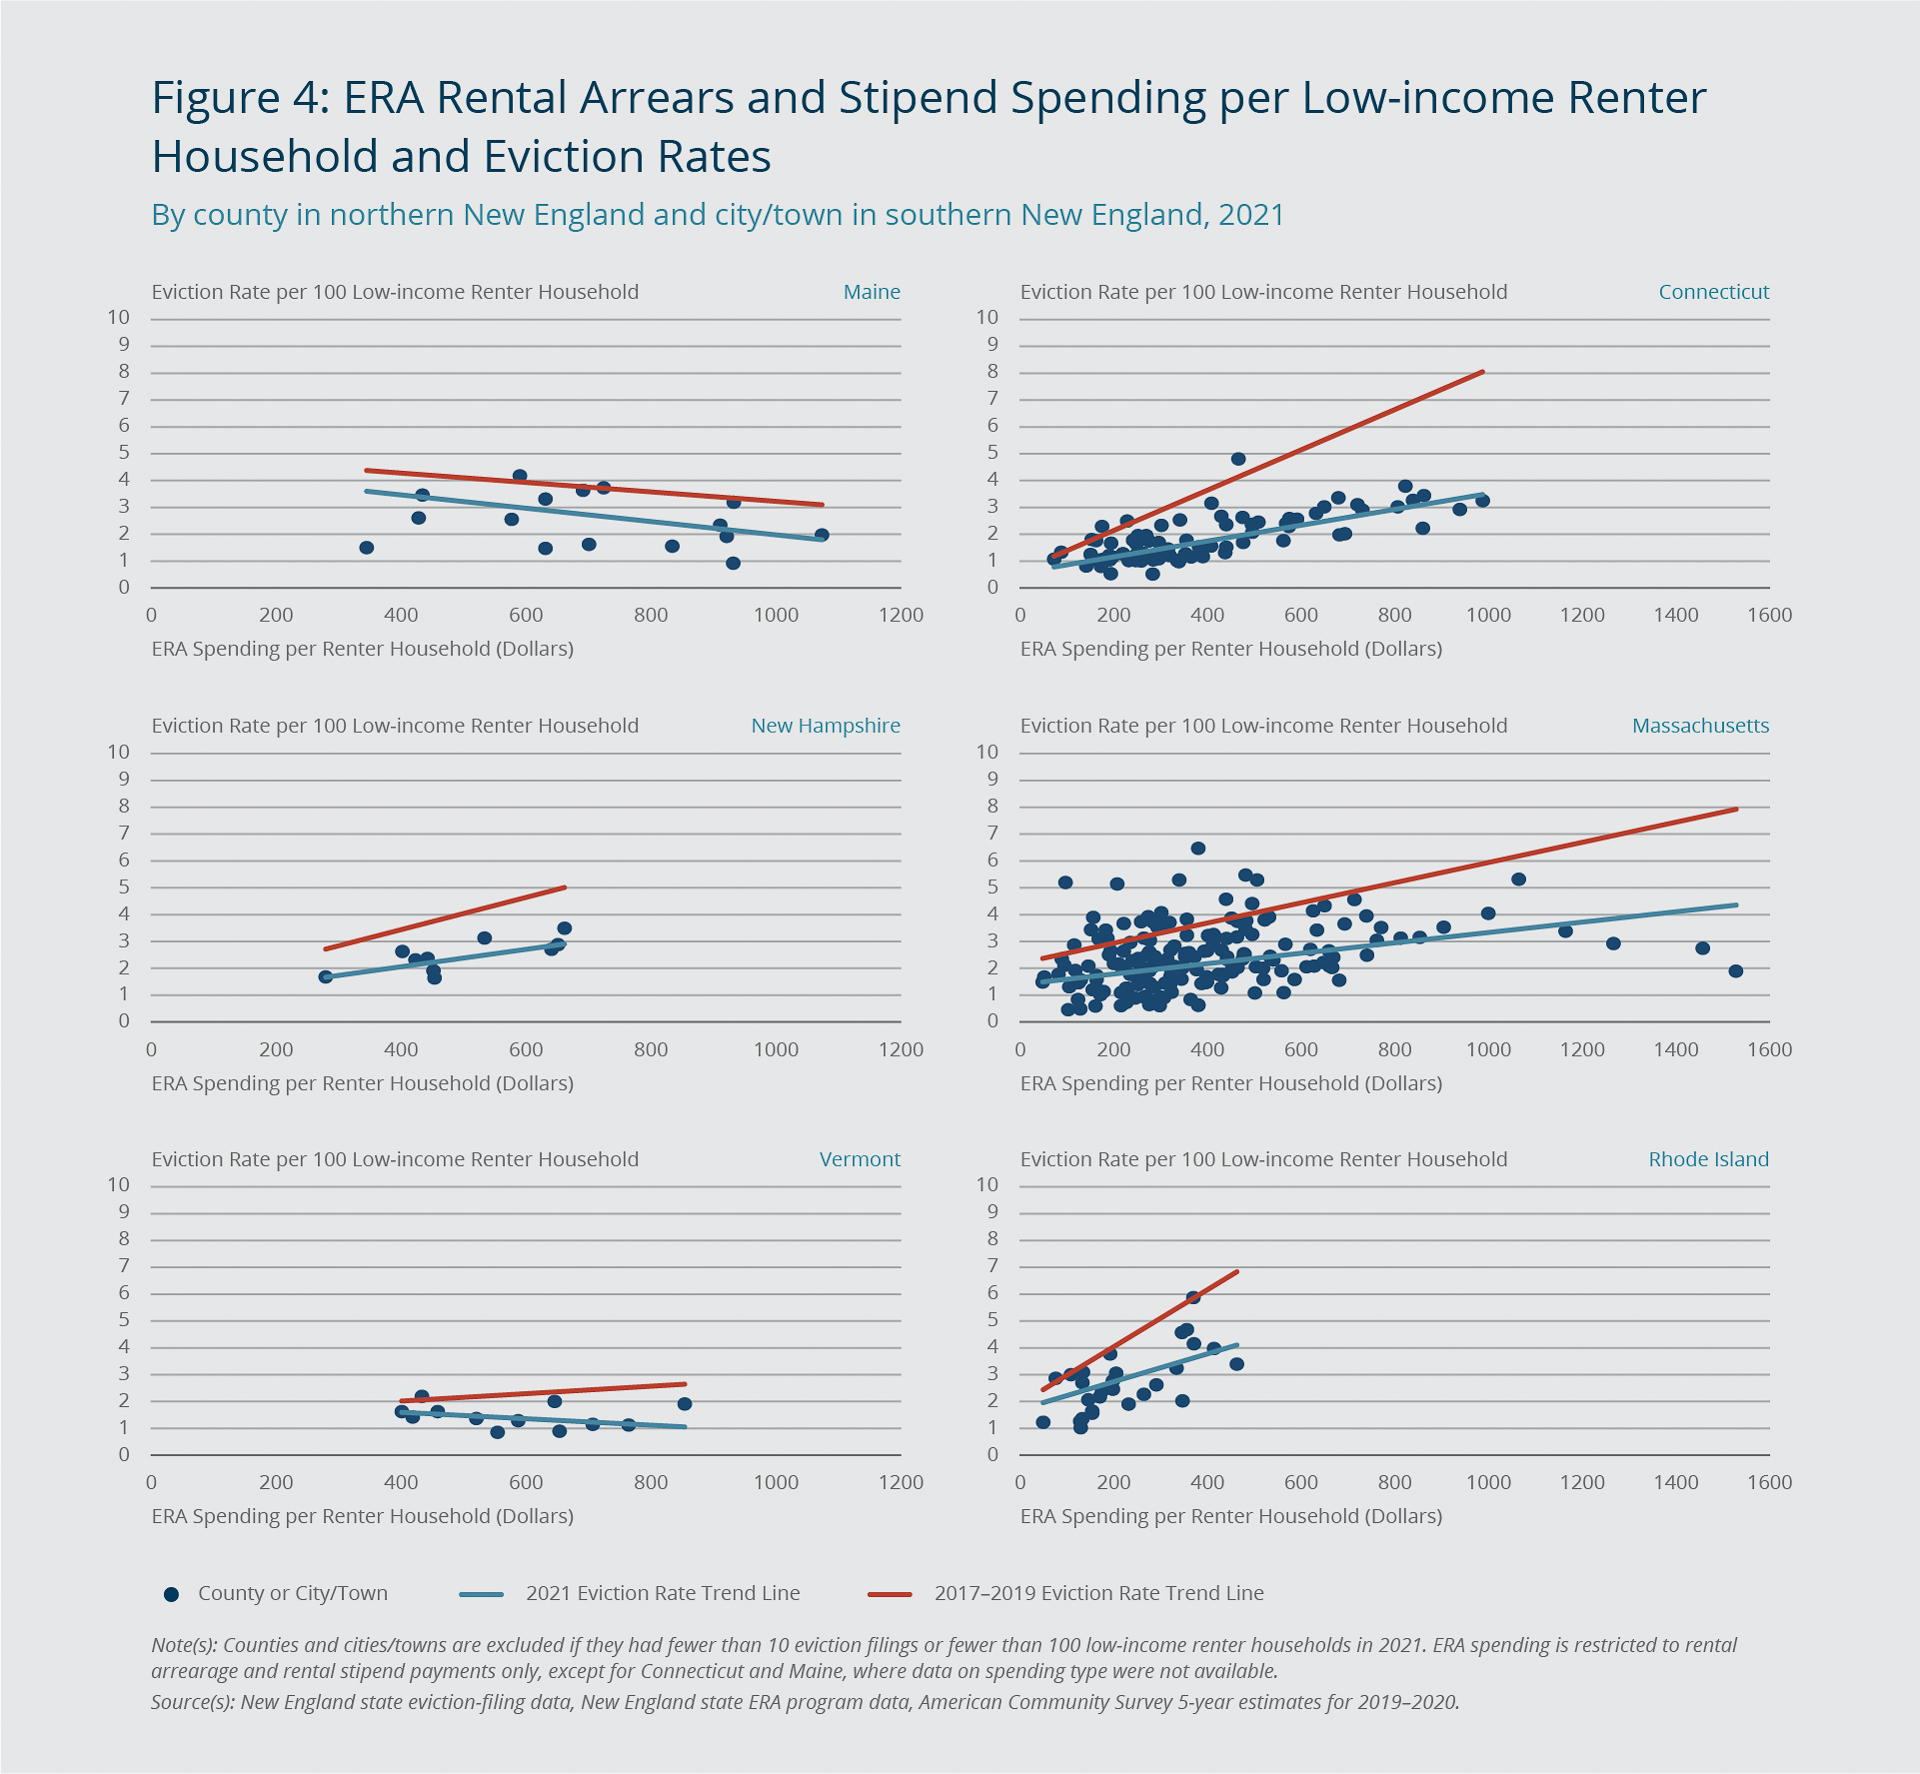
While it is difficult to determine the true impact of the ERA program, it is possible to understand how well the ERA program has been targeted to areas of greater need. Figure 4 shows the relationship between ERA spending per low-income renter household and the local eviction rate in 2021, as well as—for the sake of comparison—the relationship between ERA spending and the average annual local eviction rate for the 2017–2019 period. (In the Figure, ERA spending is restricted to spending on rental arrears and rental-stipend payments in all states except Connecticut and Maine.)
Federal Reserve Bank of Boston
Across southern New England and in New Hampshire, ERA spending and eviction rates for 2021 are positively correlated, meaning a greater amount of ERA spending per low-income renter household occurred in areas with higher eviction rates that year. This positive relationship could indicate that the ERA program did not serve the purpose of forestalling evictions, possibly because households could qualify for funding without having evictions filed against them. However, higher ERA spending in 2021 occurred in areas that also had higher eviction rates before the pandemic, indicating that ERA dollars were targeted to high-need areas. In fact, the correlation between ERA spending and pre-pandemic rates is the stronger of the two. Assuming that without the ERA program eviction rates would have been much higher, this finding suggests that the program helped reduce eviction rates in areas with historically high numbers of eviction filings.
There is evidence that Maine struggled to target its ERA program effectively to areas that needed it the most. Maine differs from the rest of New England in that the relationship between ERA spending and both the 2021 and pre-pandemic eviction rates are negative, meaning the state’s ERA program was spending less per low-income household in areas where eviction rates were both higher during the pandemic and higher historically. In Vermont, the situation is more complex. The state spent more ERA dollars per low-income renter household in areas where eviction rates have been the highest, but it did not spend more in areas where eviction rates were higher in 2021. One explanation is that Vermont, which, compared with other New England states, had far more ERA dollars to spend per low-income renter household due to its relatively small population and minimum ERA allocations, was able to reach most renter households at risk of eviction before they had an eviction filed against them. This would result in lower eviction rates in places where ERA spending was highest.
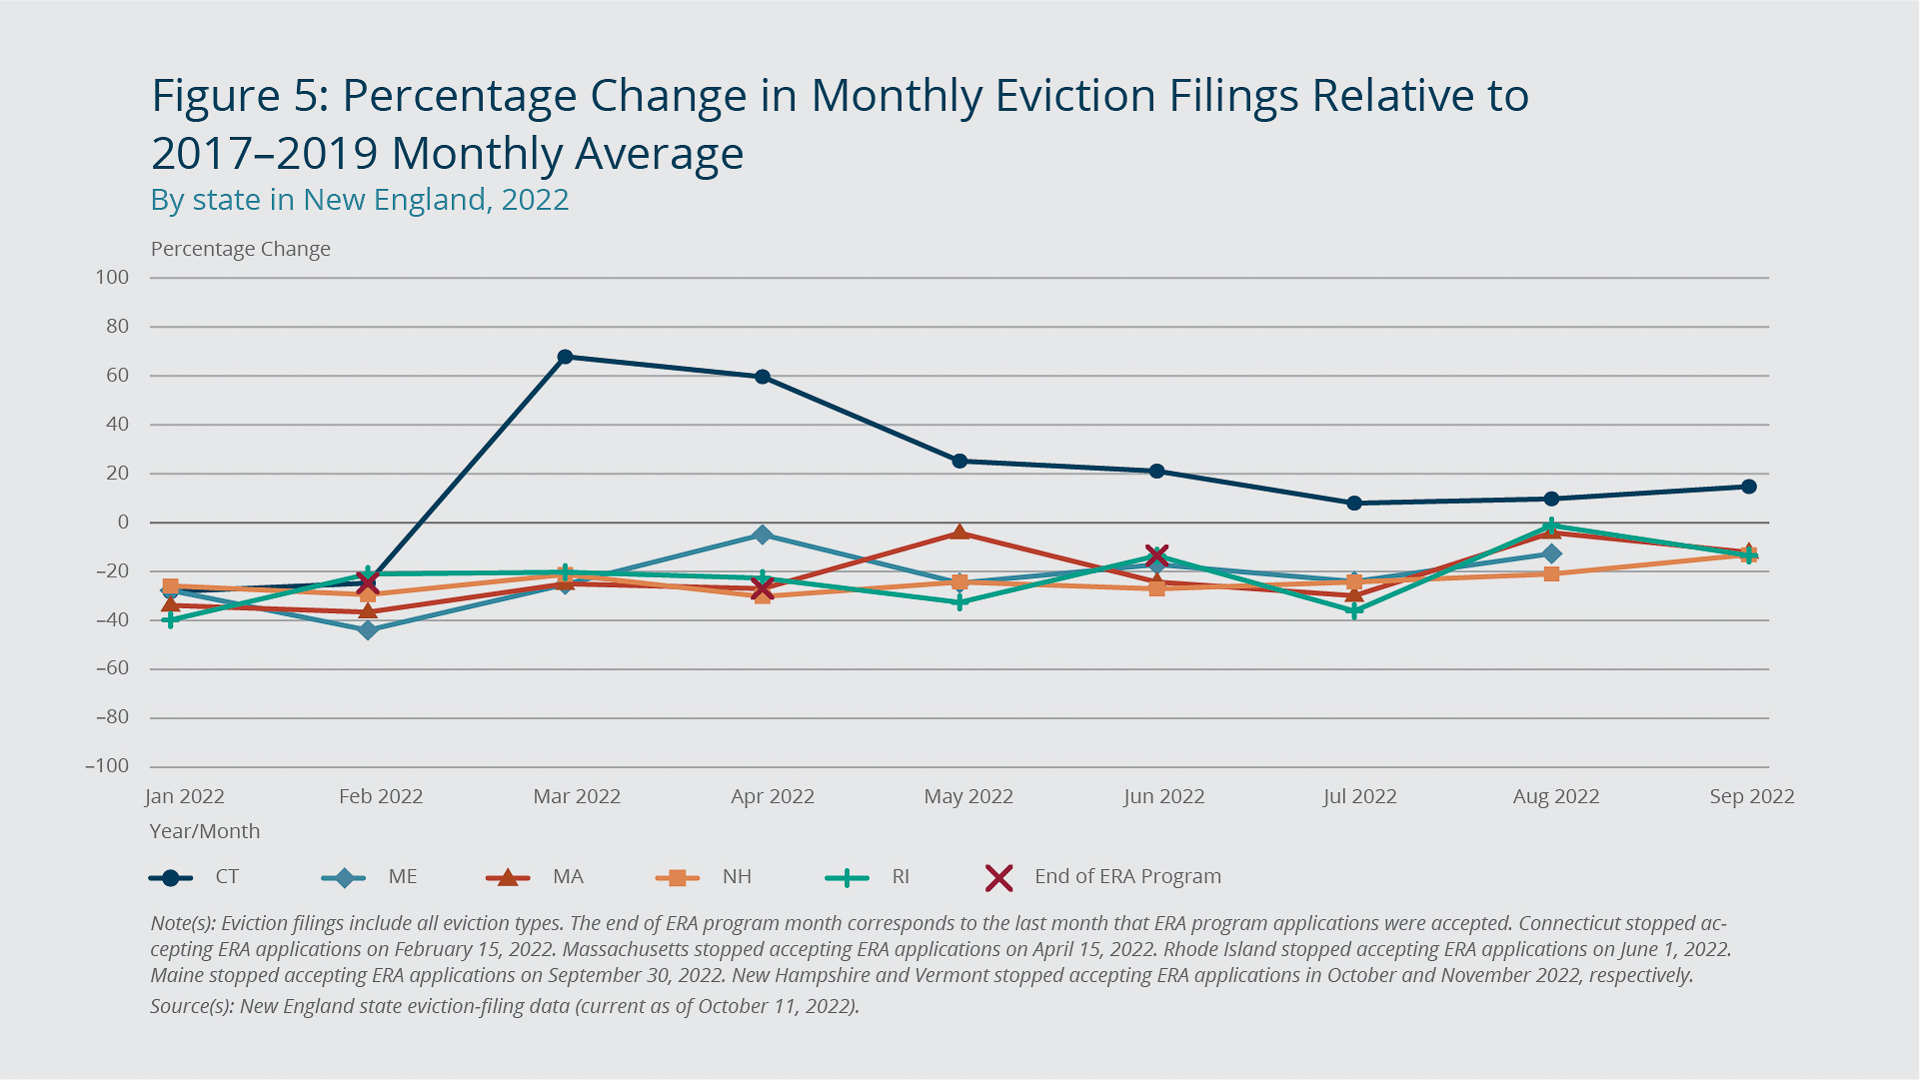
The data indicate that the ERA program prevented many renters who were behind on rent from having an eviction filed against them. In 2021, the number of approved ERA applications to pay rental arears exceeded the number of eviction filings that year by about 19,700 in Massachusetts and by about 10,800 in Rhode Island, the two states where data on the number of applications were available. As of October 2022, the northern New England states had spent 45 to 80 percent of their allocated ERA funds. As shown in Figure 5, in Connecticut, eviction filings increased dramatically after the state’s ERA program stopped accepting applications.
Federal Reserve Bank of Boston
The number of evictions filed in March 2022, the first full month after Connecticut ended its program, more than doubled compared with the number filed the preceding month and was 68 percent greater than the March average for the 2017–2019 period. In Massachusetts, eviction filings rose in May 2022, the month after the state’s ERA program ended, to within 5 percent of the pre-pandemic average for May but have remained below pre-pandemic levels. Eviction filings in Rhode Island have also increased since that state’s ERA program ended in June 2022, but they have not risen above the pre-pandemic levels. State-funded rental-assistance programs, such as the one operated by Massachusetts, may be mitigating a post-ERA rise in eviction filings in some New England states.
IV. Eviction Rates and the Housing Market
The rapid rise in housing costs has added to the financial pressure that pandemic-related high unemployment placed on renter households. According to data from CoStar, a real estate analytics company, in the last quarter of 2021, rents nationally were 10.9 percent higher than a year earlier, representing the largest single-year increase in the past 20 years.21 However, in most large metropolitan areas, especially those in New England, rents fell from 2019 to 2020 due a variety of factors, including widespread job loss that reduced household incomes, prompting landlords to reduce rents to keep tenants. In the Boston area, a decrease in the number of college students in rental markets due to the switch to remote schooling also temporarily reduced demand for rental housing. Based on an annualized change from 2019 to 2021, rent increases in New England ranged from a low of less than 1 percent to a high of 9.7 percent.22
It is unclear if the recent rise in rents led to higher eviction rates in 2021, or whether higher rents in general are associated with higher eviction rates.23 The relationship between changes in rents and eviction rates is likely nuanced. Rising rents make apartments less affordable if incomes do not rise to compensate. When housing is less affordable, renters are at higher risk of eviction if they experience a financial shock such as a job loss. However, rising rents can also indicate that an area is becoming wealthier, which may in turn reduce eviction rates. A lack of local-level rent data complicates the analysis. The CoStar rental-price data that this report uses exclude rents for apartments in buildings with fewer than five units, and in New England, about 60 percent of renters live in such buildings.24 Furthermore, renters facing an eviction are more likely to live in smaller buildings; about 70 percent of renters facing an eviction in Connecticut and Rhode Island lived in buildings with fewer than five units.25 Also, the rent data examined for this report cover only about 62 percent of the Zip codes in Massachusetts and less than half of the Zip codes in Connecticut and Rhode Island.
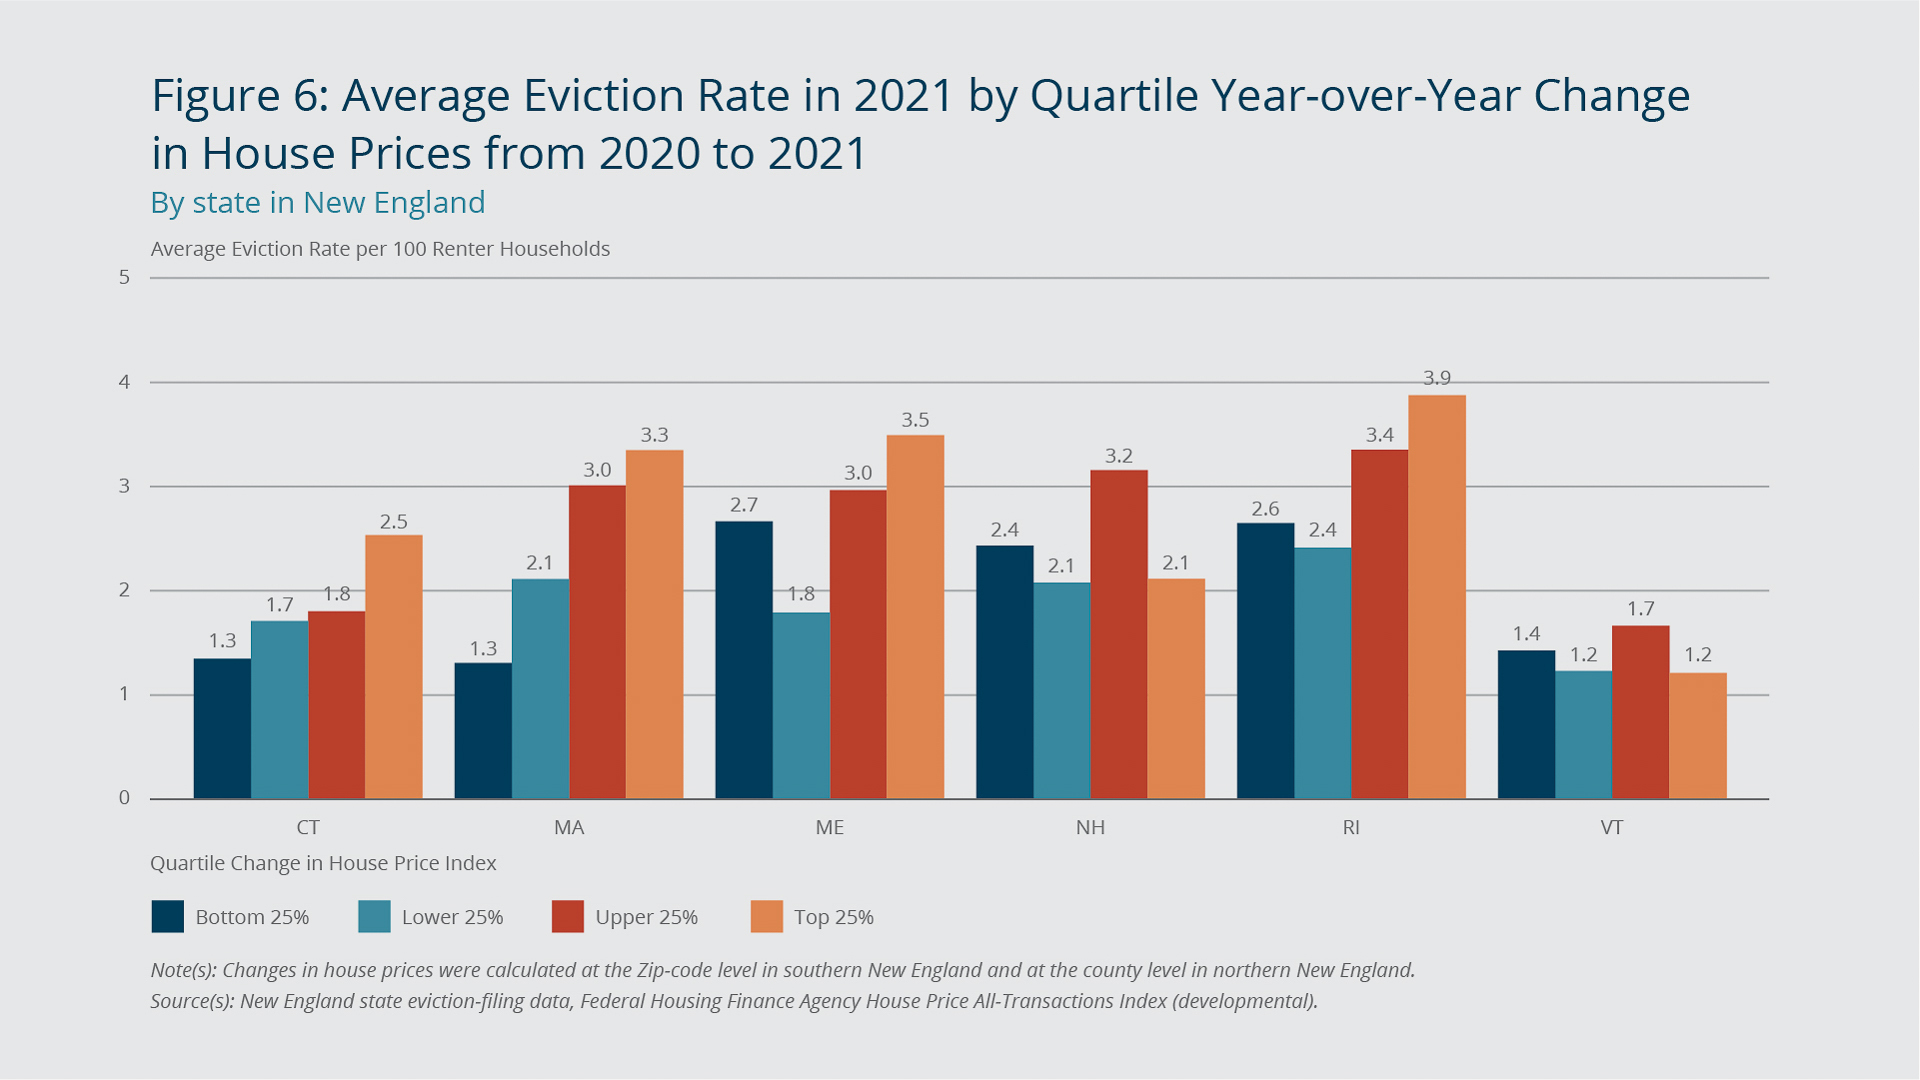
Instead of rising rents, an alternative explanation to study is changes in the prices of single-family homes. Home-price data are more widely available at the local level, and 17 to 26 percent of renters in New England live in single-family homes.26 Rising home prices can lead to higher rents by increasing the demand for rental housing as owning a home becomes more expensive.27 This report examines home prices only to highlight how changes in housing costs might affect eviction rates. Figure 6 shows the average eviction rate for each New England state based on changes in single-family home prices from 2020 to 2021, divided into quartiles. The bottom 25 percent include communities with the smallest increase in prices (or largest declines), while the top 25 percent include those with the largest increases.
Federal Reserve Bank of Boston
For all of New England in 2021, the average eviction rate for communities in the top quartile of home-price increases (top 25 percent) was 3.1 percent, compared with 2.7 percent in the upper quartile (50 to 75 percent), 1.9 percent in the lower quartile (25 to 50 percent), and 1.6 percent in the bottom quartile (bottom 25 percent). In 2021, rising home prices were more closely associated with higher eviction rates in southern New England and, to a lesser extent, in Maine. Across New England, the relationship between increasing home prices and higher eviction rates was not as strong before the pandemic. Communities in the top quartile of home-price increases averaged an eviction rate of 4.3 percent in 2019; the upper quartile averaged 3.8 percent, the lower quartile 3.5 percent, and the bottom 3.7 percent.
Without more reliable local-level rent data, it is difficult to assess how or whether the rapid rise in rents in much of New England in 2021 affected eviction rates. Renters may have been unaffected due to the ERA program’s support for low-income renters during the pandemic. However, given that one-third to one-half of ERA spending in New England has been on rental-stipend payments covering future rental payments for low-income renter households, many renters may be living in apartments that are no longer affordable without continued assistance. This raises the risk of these renters falling behind on rent and facing eviction once the stipend payments end.
V. Conclusion
The eviction crisis in New England that seemed imminent early in the COVID-19 pandemic did not come to pass in 2020 or 2021. The recovering economy and public policy responses from state and federal agencies helped to push down evictions to less than half the annual rate for the pre-pandemic 2017–2019 period. Among the New England states, Connecticut (53 percent) and Massachusetts (41 percent) saw the largest drops in eviction rates in 2021 compared with the period just before the start of the pandemic. Maine saw the smallest decline, with the filing rate decreasing 31 percent from 2019 to 2021. However, within the New England states, particularly Maine and Vermont, local eviction rates varied considerably. Smaller metropolitan and non-metropolitan areas in general saw higher eviction rates and smaller declines in 2021 compared with more densely populated areas. In Maine and, to a lesser extent, in Vermont, there is evidence that renters in some counties had difficulty accessing financial assistance through the federally funded Emergency Rental Assistance (ERA) program. Building local capacity to service more rural communities is important everywhere but especially in more rural states such as Maine and Vermont.
The ERA program undoubtably helped suppress eviction rates in 2021 and keep low-income renters in their homes. Yet, whether the rates will exceed pre-pandemic levels long term is unclear. As of October 2022, northern New England states had spent from 45 to 80 percent of their total ERA allocations. All three southern New England states—Connecticut, Massachusetts, and Rhode Island—have stopped accepting ERA applications. In Connecticut, eviction filings spiked in the two months following the end of that state’s ERA program before returning to a more typical pre-pandemic level. Without knowing how long the economic recovery will last, it is difficult to say what eviction rates might look like going forward. It is clear, however, that the ERA program helped maintain historically low eviction rates after the state eviction moratoriums ended.
Finally, the lack of local-level rental price data makes it difficult to assess how rapidly increasing housing costs in New England influenced eviction rates, but areas with larger increases in home prices from 2020 to 2021 had higher eviction rates in 2021. Rising rents also pose a conundrum for states in the absence of the ERA program. A large share of ERA funding was spent and, in states that are still operating the program, continues to be spent on rental-stipend payments. This use of funds helped low-income renters remain stably housed during the pandemic, but in this way the ERA program has operated like a rental-subsidy program, potentially keeping renters in apartments they cannot afford long term without continued support. Maintaining this support would greatly increase the financial cost that, without federal government expansion of existing programs, states would have to bear. Ending the support would risk pushing low-income renter households toward eviction.
Data Sources
Eviction filing and state ERA program data in New England provided by various partner organizations in each state.
American Community Survey 5-year Estimates from 2017 through 2021.
Bureau of Labor Statistics Local Area Unemployment Statistics from 2019 through 2021.
CoStar multifamily effective rental price data for New England–area rental submarkets from 2019 through 2021.
Federal Housing Finance Agency House Price All-Transactions Developmental County-Level Index for 2020 and 2021.
Warren Group property tax assessment records data for 2020 and 2021.
Endnotes
- Chiumenti, Nicholas. 2020. “The Impact of the COVID-19 Pandemic on New England Homeowners and Renters.” Federal Reserve Bank of Boston New England Public Policy Center Regional Brief 2020-2.
- Based on the HPS, Week 21. According to the HPS, as recently as December 2021, 16 percent of renter households nationally and 15 percent in New England reported being behind on rent payments. That the share of renters reporting unpaid rent in the HPS changed little from 2020 to 2021, despite the financial supports available, illustrates the challenge of estimating the financial condition of renter households with the limited data available. Without a pre-pandemic baseline for comparing responses in the HPS, it is difficult to know if the share of renter households reporting that they are behind on rent constitutes an increase in financial insecurity among renter households, or if it reflects their typical level of precarity.
- This report uses the 2017–2019 period because doing so helps to account for specific local economic conditions that may have influenced the number of monthly or annual eviction filings. Data for New Hampshire were available only from 2019 onward; therefore, for this state, references to the pre-pandemic period refer solely to the year 2019.
- Data on national-level evictions come from the Eviction Lab, a research center at Princeton University. The latest pre-pandemic year for which national-level eviction-rate data were available was 2016, so changes in the national rate in 2020 and 2021 are relative to 2016 and represent only the 12 U.S. states for which pandemic-era eviction-rate data were available in the most recent two years.
- Based on the Eviction Lab’s “Covid-19 Housing Policy Scorecard” reports. In every New England state except New Hampshire, the eviction moratoriums began as state judicial policy or were due to court closures halting hearings on non-emergency court cases. Each of these judicial moratoriums ended sometime between the start of May and the end of September 2020. Massachusetts and Vermont followed the judicial moratoriums with legislative moratoriums. Connecticut’s judicial moratorium was replaced with a gubernatorial executive order. In New Hampshire, the eviction moratorium was enacted solely through gubernatorial executive order. In Maine and Rhode Island, no additional eviction moratoriums were put in place after the expiration of the judicial moratoriums and the reopening of the courts.
- In September 2020, Connecticut’s governor issued an executive order allowing eviction filings for “serious” nonpayment of rent, defined by the executive order as unpaid rent exceeding six months.
- Hepburn, Peter, Renee Louis, Joe Fish, Emily Lemmerman, Anne Kat Alexander, Timothy A. Thomas, Robert Koehler, Emily Benfer, and Matthew Desmond. 2021. “U.S. Eviction Patterns in 2020.” Socius: Sociological Research for a Dynamic World 7: 1–18.
- Congressional Research Service. 2021. “The CDC’s Federal Eviction Moratorium.” CRS Insight IN11673.
- On average, in southern New England during the 2017–2019 period, annual eviction rates were 82 percent higher in majority non-Hispanic Black communities and 52 percent higher in majority Hispanic communities compared with majority non-Hispanic White communities. Eviction rates in these majority-minority communities declined substantially in 2021 compared with the 2017–2019 annual averages, falling 65 percent in majority non-Hispanic Black communities and 47 percent in majority Hispanic communities. Eviction rates seen in majority non-Hispanic White communities during this period declined by 41 percent. These findings are based on New England state eviction-filing data and American Community Survey 5-year estimates for 2019 and 2020.
- Based on American Community Survey 5-year estimates for 2019 and 2020.
- Chiumenti, Nicholas. 2021. “Rental Affordability and COVID-19 in Rural New England.” Federal Reserve Bank of Boston New England Public Policy Center Regional Brief 2021-1.
- Based on 2013 USDA Rural-Urban Continuum Code definitions.
- Nantucket County in Massachusetts was the only county in New England that had a higher eviction rate in 2021 compared with its pre-pandemic rate. It was 66 percent higher; however, the total number of evictions in 2021 remained quite small at 33 filings.
- In southern New England, where data are available at the city or town level, the correlation between 2021 average eviction rates and average annual unemployment was positive and statistically significant (p < .05), with coefficients ranging from 0.44 to 0.70. In northern New England, coefficients ranged from –0.04 to 0.06 and were not statistically significant, likely due to data in this part of New England being available only at the county level.
- Based on 2020 and 2021 Bureau of Labor Statistics Local Area Unemployment Statistics, annual average unemployment rates.
- Maine Executive Order No. 5 FY 20/21 and Bernstein, Carrie, Calandra Clark, Ian Dinnie, Tom Harper, Mark Melnik, Abby Raisz, and Clark Ziegler. 2021. “The Greater Boston Report Card 2021.” The Boston Foundation.
- Based on total ERA appropriations as of May 2022 reported by the National Low Income Housing Coalition and 2020 American Community Survey 5-year estimates of the low-income renter household population in each state.
- U.S. Department of the Treasury. 2021. “Emergency Rental Assistance Frequently Asked Questions.” Revised June 24, 2021.
- Based on ERA program spending dashboard data for the New England states (excluding Vermont) as of May 25, 2022. The share of ERA spending on non-arrearage rental expenses in Vermont is based on 2021 ERA program spending data.
- Total ERA program spending per low-income rental household is negatively correlated with changes in eviction rates from 2019 to 2021 in every New England state except Rhode Island, but the correlation is statistically significant (p < .05) in Connecticut, Massachusetts, and Vermont only.
- Joint Center for Housing Studies. 2022. “America’s Rental Housing 2022.” Harvard University.
- Based on CoStar annualized changes in fourth-quarter effective rents from 2019 to 2021 for New England–area rental submarkets.
- Based on rent data from CoStar. In Massachusetts, higher annualized rent increases from 2019 to 2021 are associated with higher eviction rates in 2021. Massachusetts Zip codes with rent increases from 2019 to 2021 that were in the top 25 percent had an average eviction rate of 2.6 percent in 2021, compared with a rate of 1.3 percent among Zip codes in the bottom 25 percent. In Connecticut, higher rent increases are associated with lower average eviction rates, with Zip codes in the top 25 percent averaging an eviction rate of 1.9 percent in 2021, compared with a rate of 2.3 percent among Zip codes in the bottom 25 percent. In Rhode Island, there is essentially no relationship between rent changes from 2019 to 2021 and eviction rates in 2021.
- Based on American Community Survey 5-year estimates for 2020.
- Based on address-level eviction records for Connecticut and Rhode Island matched to Warren Group property tax assessment records. About 71 percent of the eviction records in Connecticut and 68 percent of the records in Rhode Island resulted in a direct address match.
- Based on American Community Survey 5-year estimates for 2020.
- Gallin, Joshua. 2008. “The Long-run Relationship between House Prices and Rents.” Real Estate Economics 36(4): 635–658.

 About the Authors
Nicholas Chiumenti
Acknowledgments
The author is grateful to the many individuals and organizations who helped secure access to data or who provided background on local eviciton laws and state-specific ERA program regulations. In particular, the author thanks the Connecticut Fair Housing Center, RI Housing, the Maine Affordable Housing Coaltion, Pine Tree Legal Assistance, the Massachusetts Department of Housing and Community Development, the Massachusetts Trial Court, the Vermont State Housing Authority, Vermont Legal Aid, and the Vermont Judiciary.
Resources
Site Topics
Keywords
- New England ,
- NEPPC ,
- eviction moratoriums ,
- COVID-19 ,
- rental assistance