2017 Series • No. 17–5
Current Policy Perspectives
Sectoral Inflation and the Phillips Curve: What Has Changed since the Great Recession? 
The aggregate Phillips curve, a pillar of inflation dynamics models, predicts that as the labor market tightens, prices eventually face an upward pressure, and inflation rises. Yet, while the unemployment rate decreased from a peak of 9.9 percent in the fourth quarter of 2009 to 4.3 percent in the third quarter of 2017, core inflation remained below the Federal Open Market Committee’s target of 2 percent.
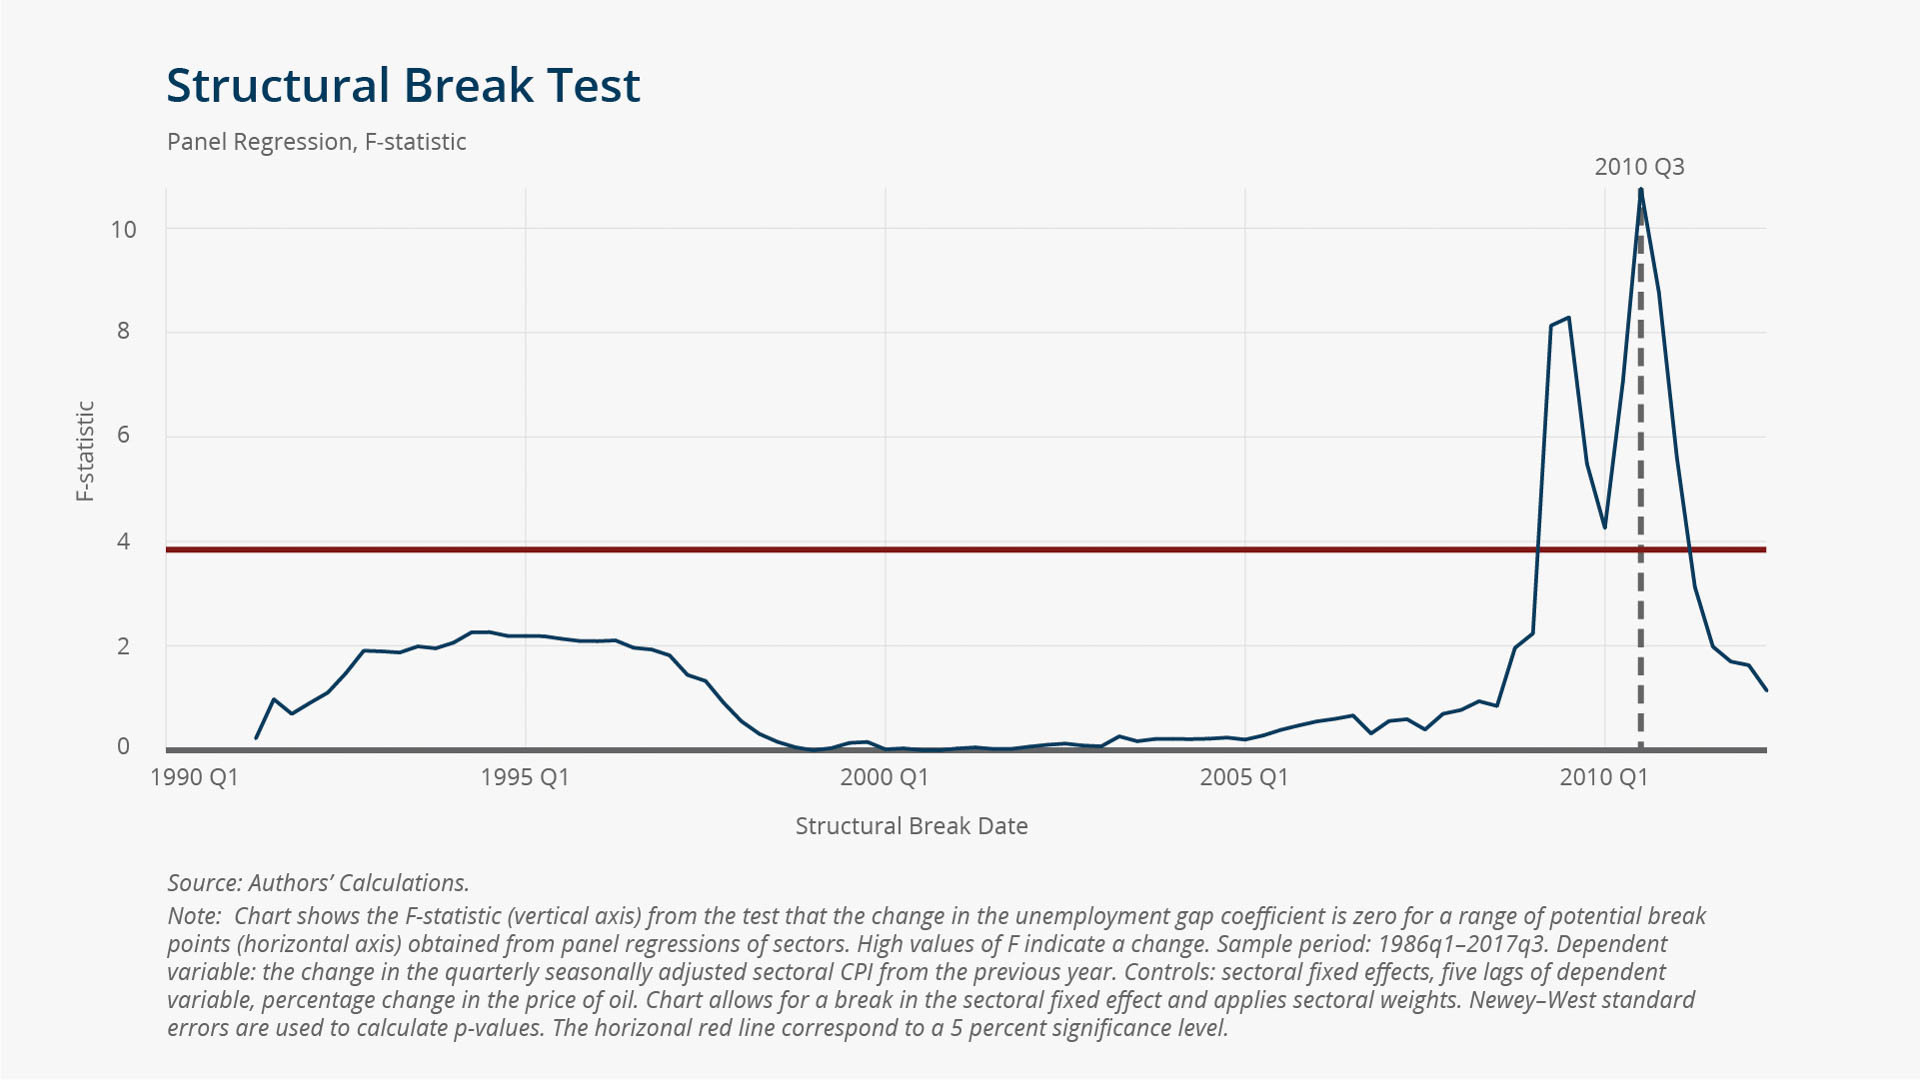
This anomaly has led some economists to question the usefulness of the aggregate Phillips curve as a model for policy analysis. However, others continue to believe the Phillips curve remains informative, and that the recent changes in inflation dynamics can be reconciled with the models by allowing for a structural break in model parameters.
This policy brief looks at disaggregated inflation data to see whether a sectoral Phillips curve, which characterizes the relationship between sectoral inflation and aggregate unemployment, can explain changing inflation dynamics. Sectoral data provide rich variation in disaggregated inflation rates within and between sectors and allow us to identify the sectors that may have contributed the most to a possible break. With this approach, we also can more closely consider individual inflation series. For example, we can study inflation persistence at the sectoral level. Using disaggregated inflation data also enables us to investigate the role of transitory sectoral shocks, some of which, including price wars in the communications sector, have been the focus of recent inflation debates.


 Key Findings
- Sectoral inflation became less responsive to aggregate unemployment around 2009–2010.
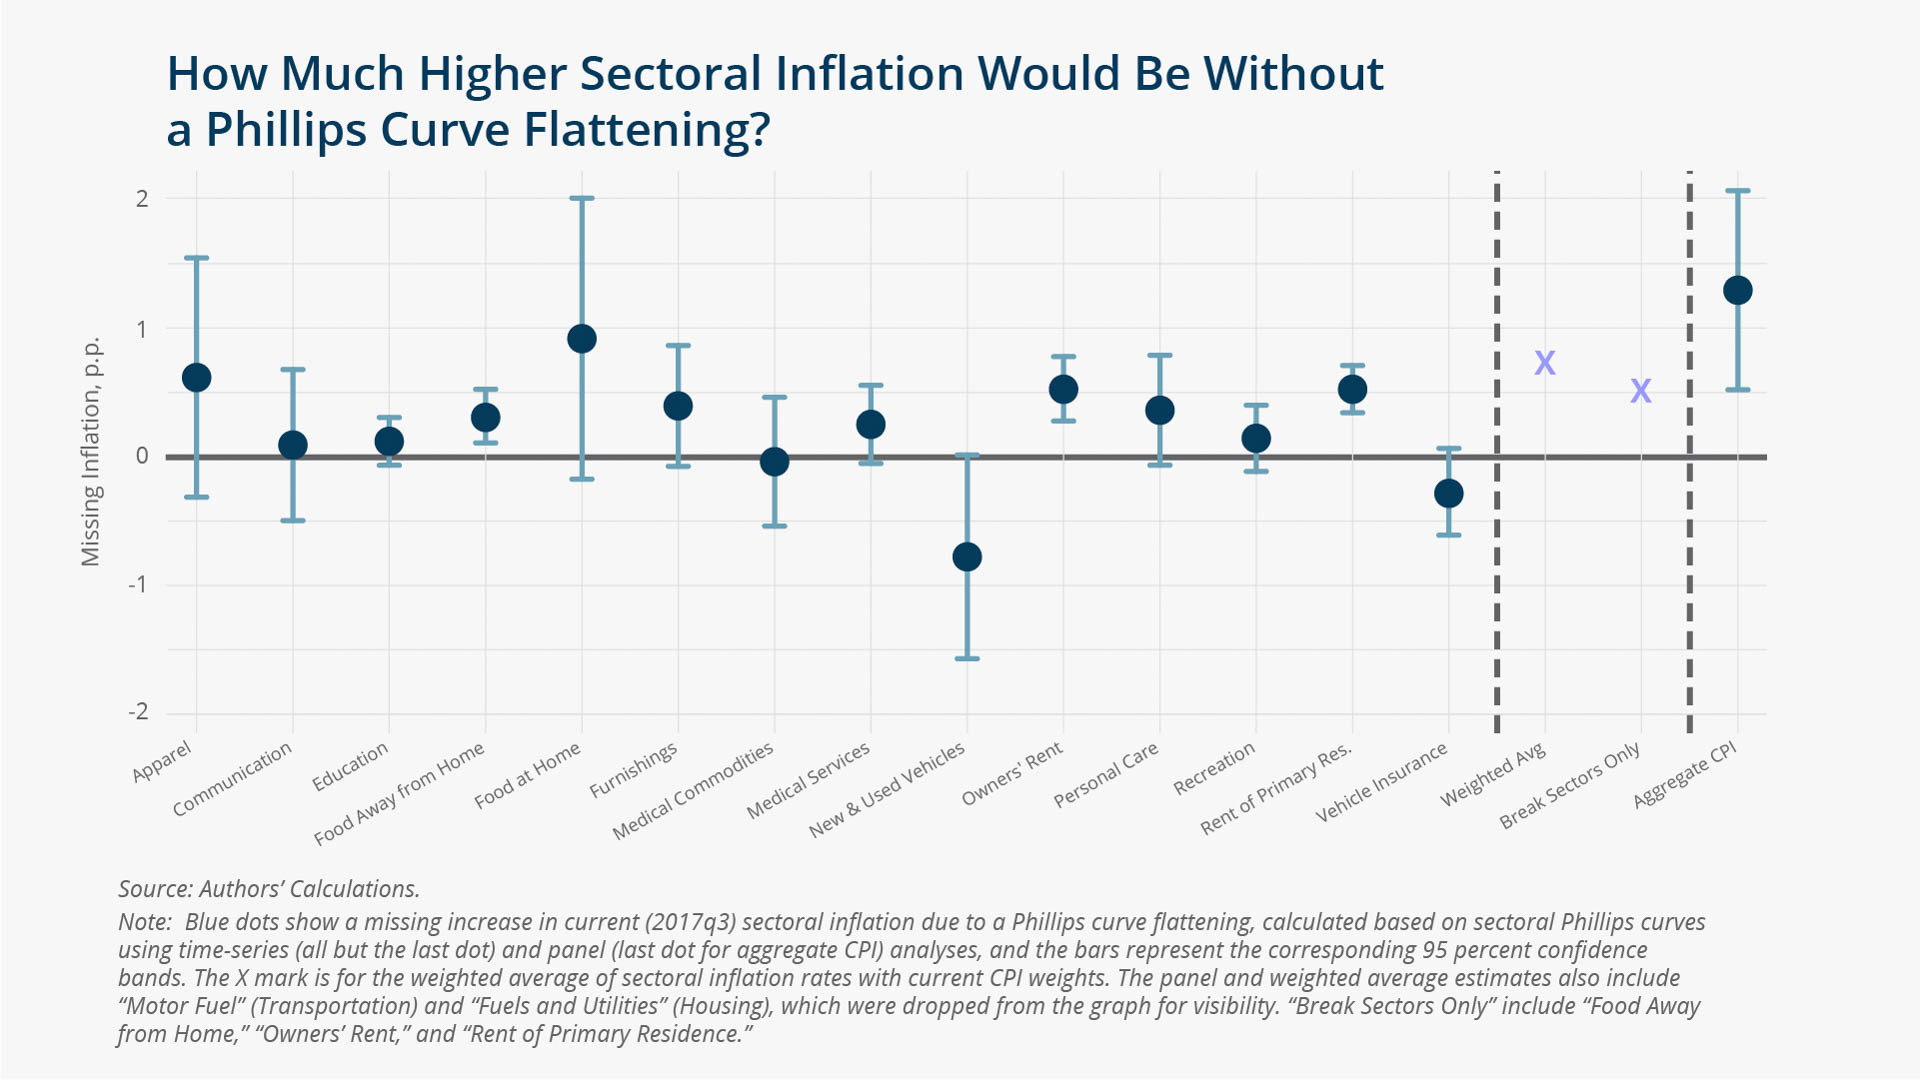
- The slopes of the disaggregated Phillips curves diminished in many sectors, including housing and food away from home.
- Such categories did not necessarily experience a significant technological revolution, nor were they affected by global trends in prices for tradeable goods.
- Univariate sectoral inflation persistence decreases after the break.
- Combining reduced-form Phillips curve estimates with a theoretical model shows that the documented decrease in inflation persistence is associated with an increase (decrease) in the weight of the forward-looking (backward-looking) inflation expectation component.
Exhibits
Implications
Our results have broad implications for economic models and monetary policy. With respect to theory, a structural break in key reduced-form parameters of the Phillips curve calls for a study of the break’s origin in terms of micro-founded structural parameters. On the policy side, a Phillips curve flattening implies a slower response of inflation to policy tools, potentially requiring an adjustment of the policy-rate path obtained from historical observations. Regarding the decline in inflation persistence, our findings imply that low inflation in the past may not necessarily be indicative of low inflation in the future.
Abstract
Using sectoral data at a medium level of aggregation, we find that price changes became less responsive to aggregate unemployment around 2009–2010. The slopes of the disaggregated Phillips curves diminished in many sectors, including housing and some services. We also document a decrease in sectoral inflation persistence, suggesting an increase in the weight of the forward-looking inflation expectation component and a decrease in the weight of the backward-looking component.