Housing Trends: Older Households Are Moving Less, and Multigenerational Living Is Rising 


The views expressed herein are solely those of the author and should not be reported as representing the views of the Federal Reserve Bank of Boston, the principals of the Board of Governors, or the Federal Reserve System.
Among the many economic and social disruptions that accompanied the onset of the COVID-19 pandemic was a sharp drop in the number of US individuals and families who change residences. This decline in household mobility, which has exacerbated a longer-term trend that began at least two decades ago, could reflect housing supply issues. According to Zillow housing data, for-sale inventory declined 30 percent from March 2020 to March 2024, and in 2021 and 2022, according to US Census Bureau data, rental vacancy rates fell to their lowest levels in four decades. More recently however, rental vacancy rates have recovered modestly, and for-sale inventory rose 18 percent from March 2024 to March 2025.
The recent, dramatic decline in household mobility also could be related to mortgage rates. Millions of homeowners refinanced their mortgages in the early stages of the pandemic, when interest rates were extraordinarily low. Research from the Federal Reserve Bank of New York finds that during this “refinance boom,” which began in the second quarter of 2020 and lasted through the fourth quarter of 2021, roughly one-third of outstanding mortgage balances were refinanced (Haughwout et al. 2023).
Sign up for Research Department Updates.
Interest rates surged in 2022 and have remained elevated, meaning that, generally, homeowners who acquired low rates have had the choice of staying in their current residence with their existing mortgage or moving and taking out a new mortgage at a considerably higher interest rate. The Mortgage Bankers Association mortgage loan applications index suggests that a large share of homeowners who obtained mortgages during the boom have chosen to stay put; the index fell 80 percent from March 2020 to March 2024.
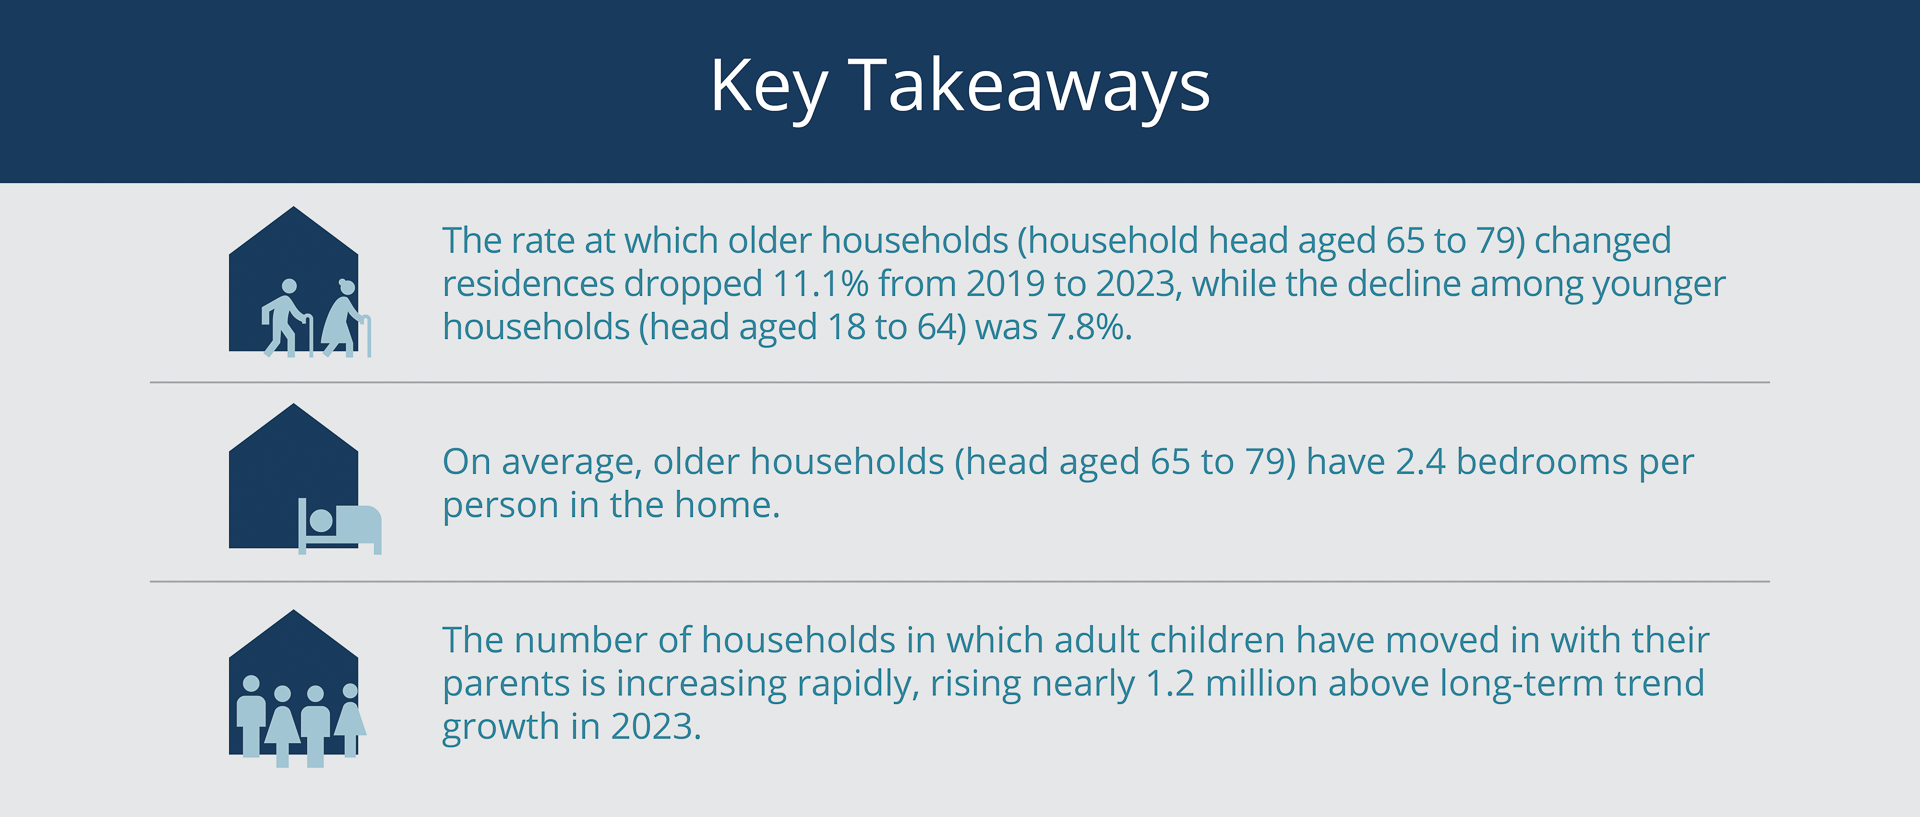
Data from the US Census Bureau’s American Community Survey (ACS) show that the decline in mobility has been more pronounced for older households, as defined by the household head’s age. From 2019 to 2023, the mobility rate of households headed by someone aged 65 to 79 dropped 11.1 percent, whereas the decline among younger households (household head aged 18 to 64) was 7.8 percent (Ruggles et al. 2025). Although older homebuyers with equity from their previous home tend to be less exposed to mortgage costs, a survey by the National Association of Realtors found that, from July 2023 to June 2024, a majority (61 percent) of the primary-residence homebuyers in their 60s financed the purchase, as did nearly half (49 percent) of the homebuyers aged 70 to 78 (NAR 2025).
The ACS data also show that older households (head aged 65 or older) tend to reside in homes with a surplus of living space, as measured by the number of spare bedrooms and likely, in many cases, the result of parents becoming empty nesters. This finding suggests that the declining mobility of older households could be exacerbating the lack of housing inventory. Using a simple counterfactual exercise, I estimate that more than 500,000 additional bedrooms—nearly 13 percent more—may have been available in 2023 if the mobility of older households had remained at its 2019 level.
A related trend involves multigenerational living. According to the ACS, the incidence of adults living with their parents accelerated at the start of the pandemic and has remained above trend. This increase in such living arrangements could be driven at least partly by the limited supply of housing, but it also could be relieving some demand-side pressure on the housing market.
Household Mobility Has Declined for All Age Groups
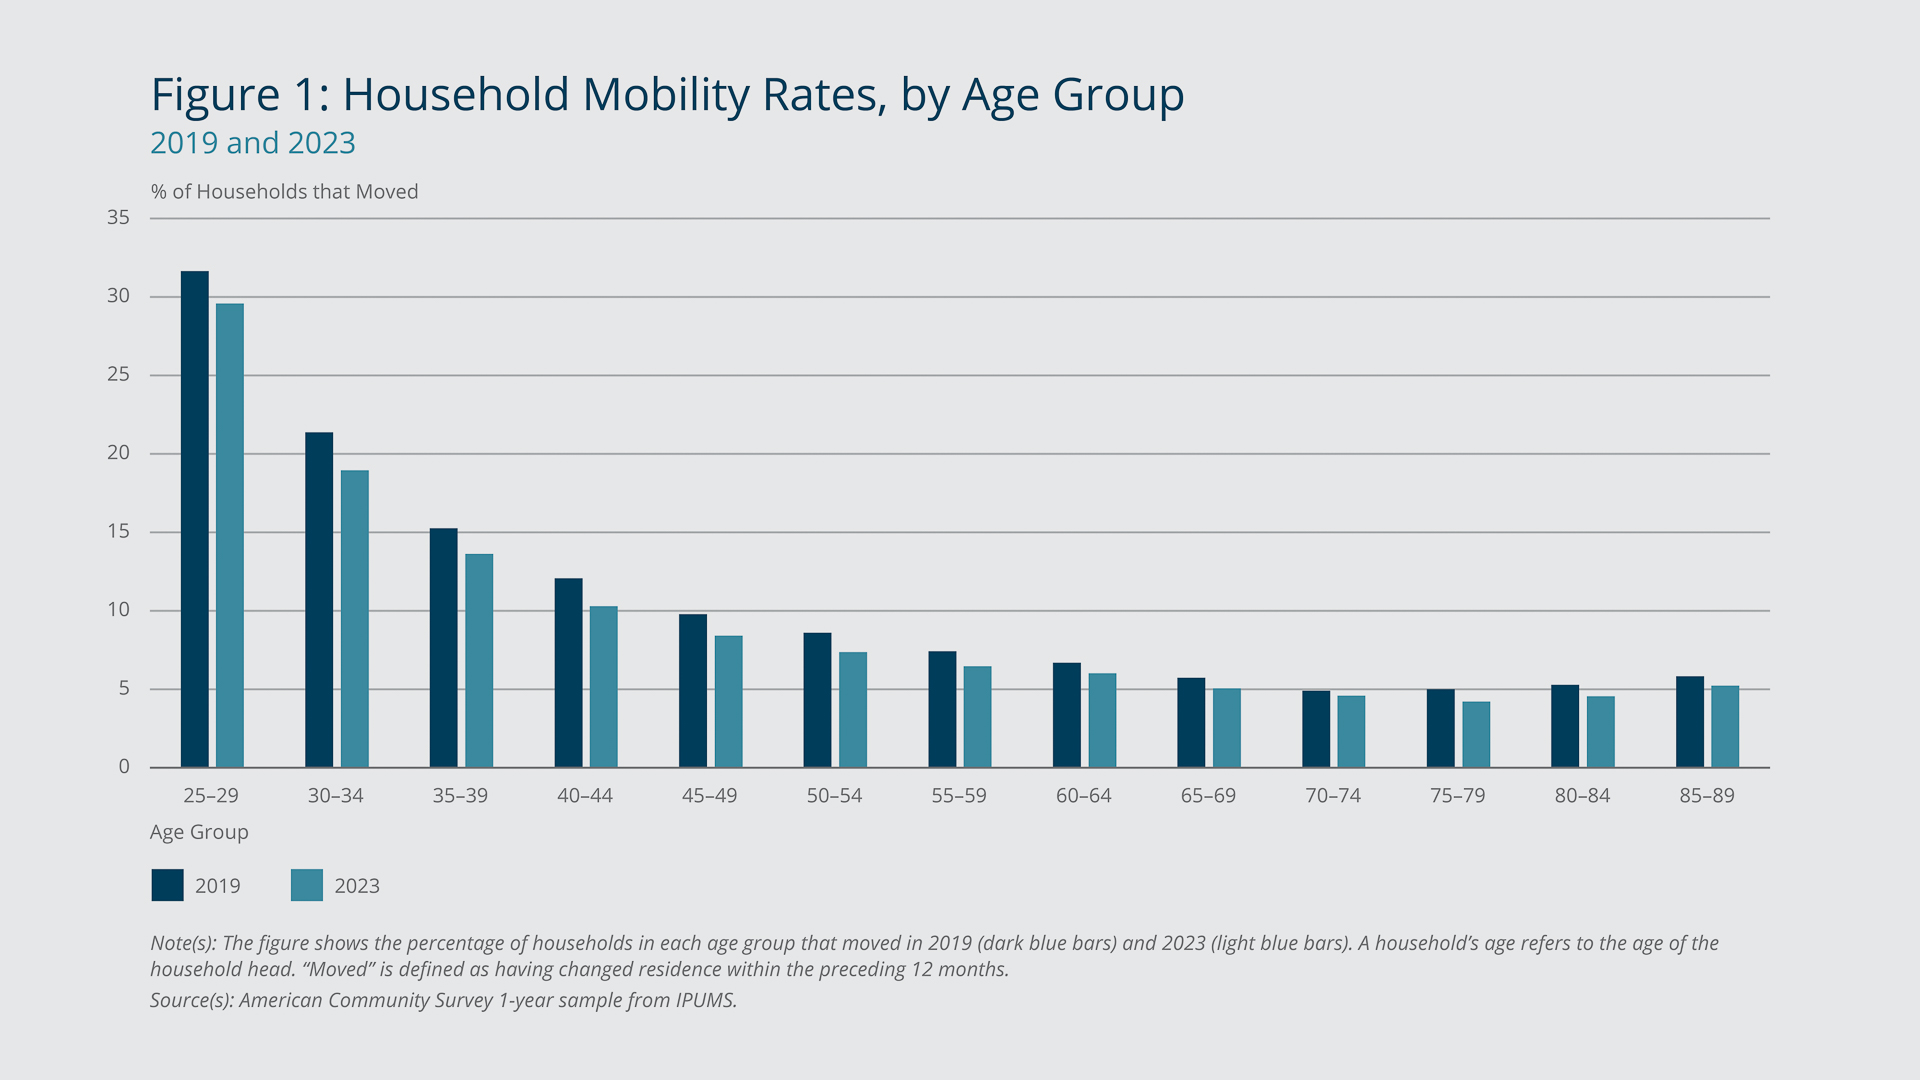
Figure 1 shows the household mobility rates by age group (of the household head) in 2019 and 2023 based on ACS responses to questions about moving. “Moving” is defined as having changed residence within the preceding 12 months. Before and after the pandemic, the 25–29 age group had the highest mobility rate (the share of households that moved). In 2019 and 2023, the rate declined steadily through the 70–74 age group before beginning to increase slightly with the 75–79 age group. After the onset of the pandemic, the mobility rate for each age group shifted downward. This shift was gradual, starting in 2021 and continuing to 2023, when mobility rates hit a new low. (Throughout this brief, estimates for 2020 are not included due to pandemic-related issues with data collection.)
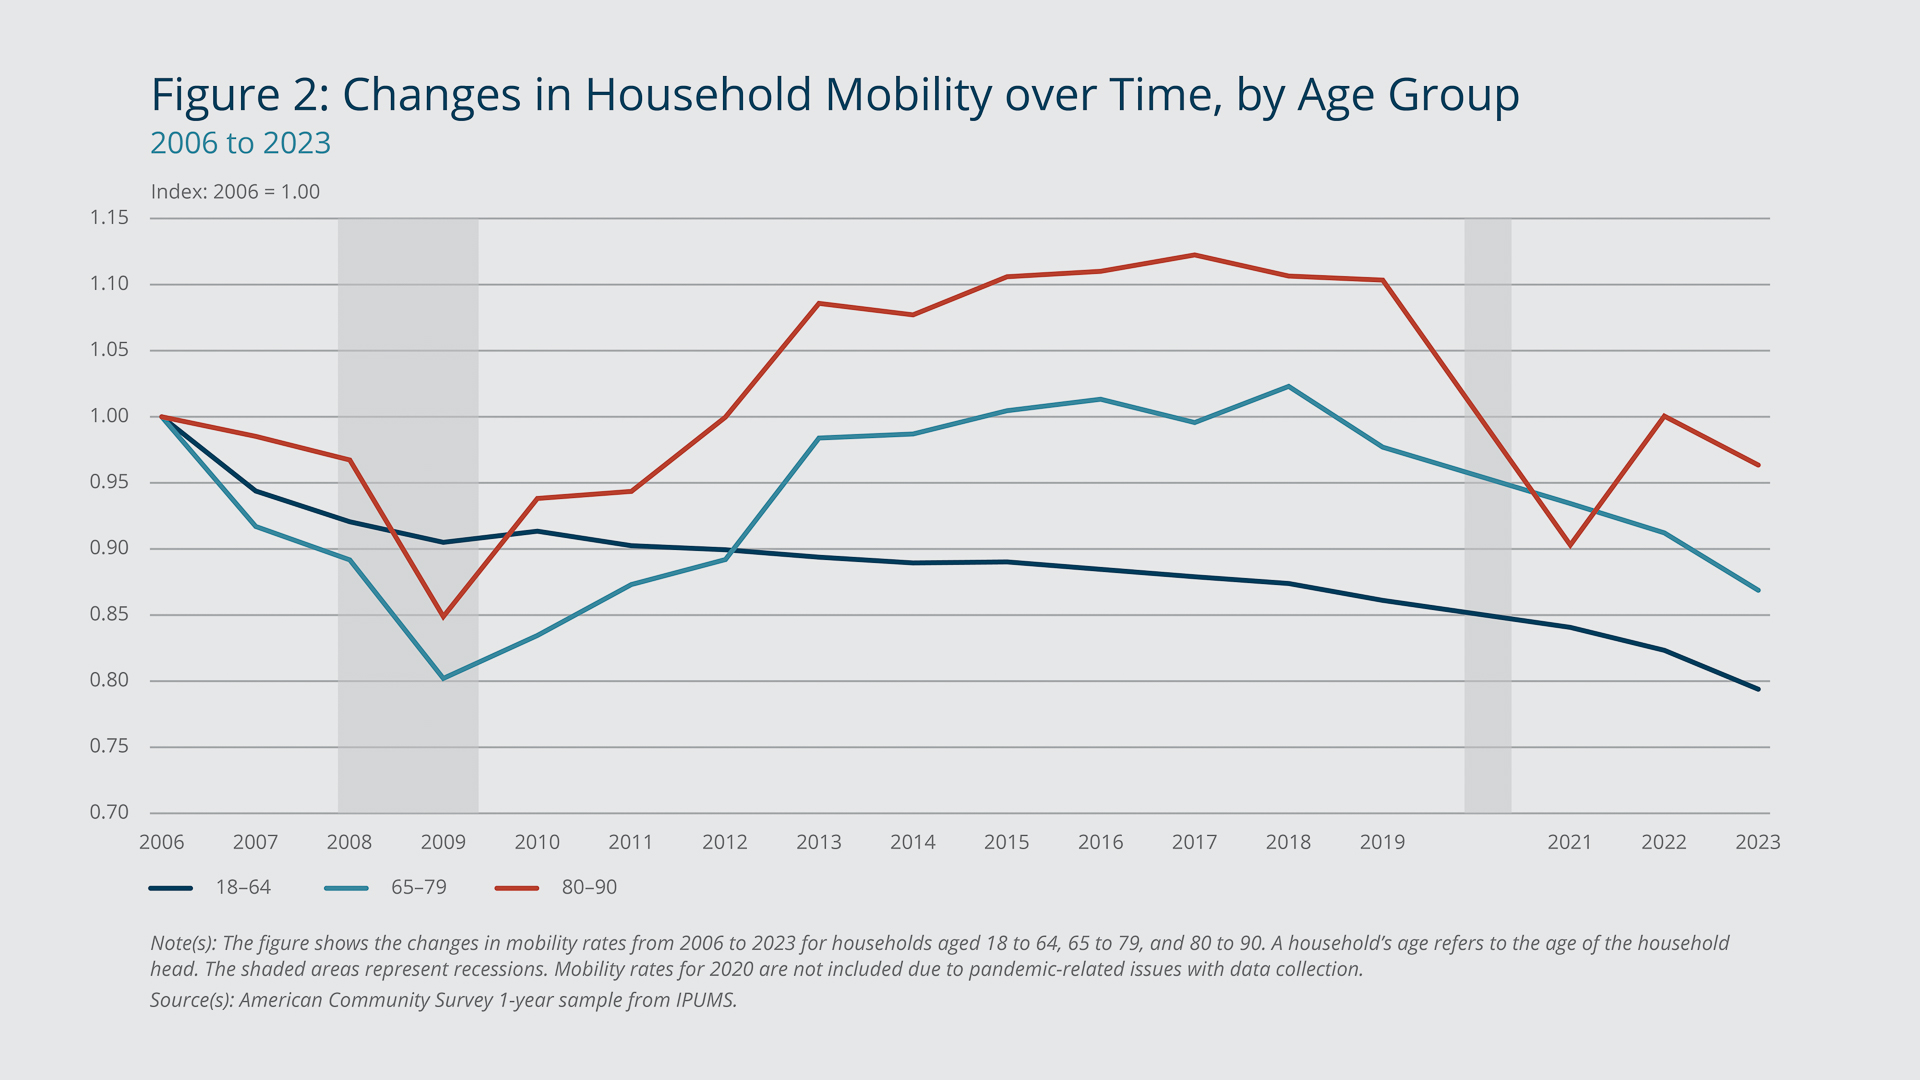
Figure 2 illustrates the change in mobility from 2006 to 2023 for households in each of three age groups: 18 to 64, 65 to 79, and 80 to 90. Each group exhibits a clear reduction in mobility relative to 2006. However, the mobility rates of the older groups (orange and green lines) appear to have been more sensitive to economic cycles, having fallen more sharply during the 2008–2009 financial crisis, rebounding, and falling again just before and continuing through the COVID-19 recession. The mobility of the younger group (blue line) has declined more steadily and was lower in 2023 relative to 2006 compared with the rates of the older groups. However, from 2019 to 2023, as noted earlier, the mobility rate for the 65–79 group declined more than the rate for the 18–64 group, 11.1 percent versus 7.8 percent.
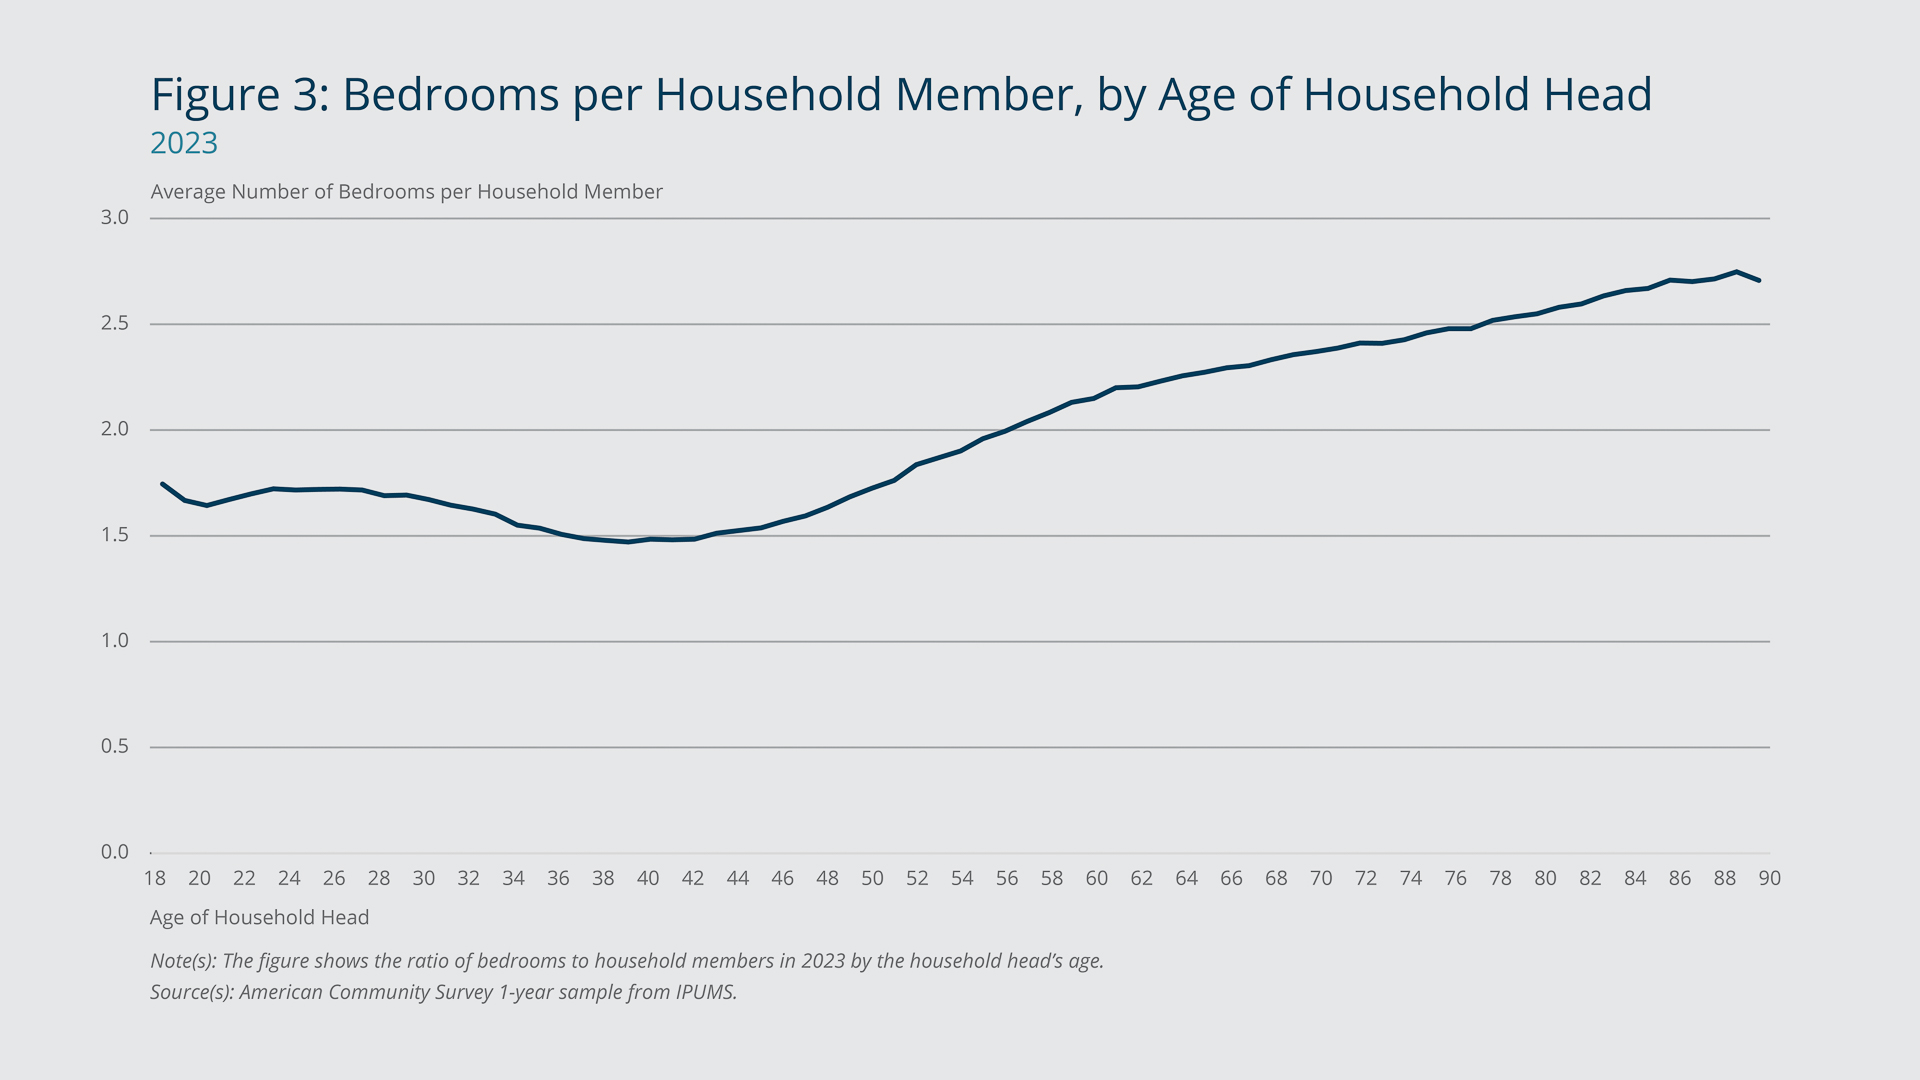
The amount of surplus living space in homes also varies across age groups. Figure 3 shows the ratio of bedrooms to household members by the household head’s age. The 2023 data show that, on average, younger households (head aged 18 to 64) have roughly 1.5 to 2.0 bedrooms per person in their homes. This ratio climbs to 2.4 for households whose head is aged 65 to 79, and it is even higher for households whose head is in their 80s. The higher ratios for the older households are likely due to a large number of household heads (and spouses if present) remaining in their home after they became empty nesters.
Impact of Older Households’ Reduced Mobility on the Housing Market
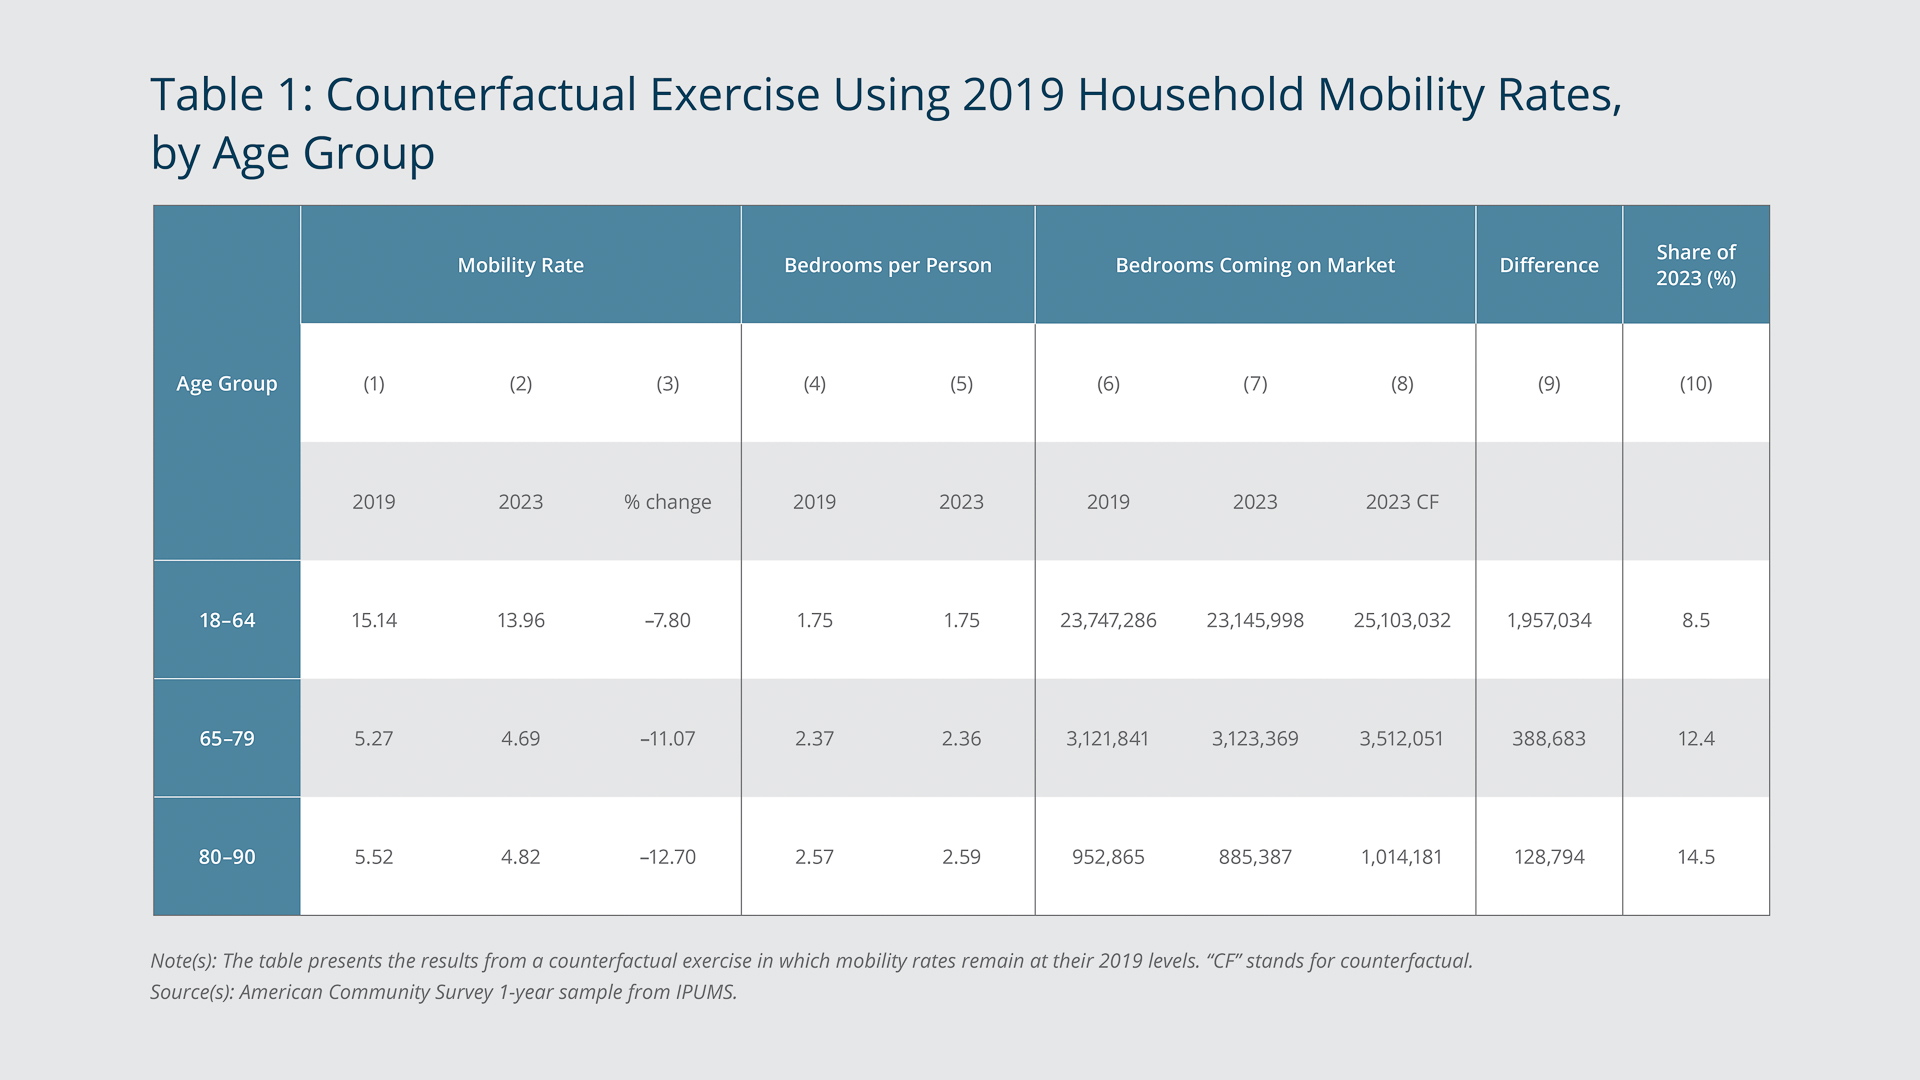
Because older households tend to live in larger houses with more bedrooms, that age group’s reduced mobility likely has had an outsized impact on the availability of housing. To estimate the magnitude of this impact, I conduct a simple counterfactual exercise in which household mobility rates remain at their 2019 levels. The results show that 12.4 percent more bedrooms—nearly 390,000—may have come on the market in 2023 if the mobility rate for older households (head aged 65 to 79) had remained at its 2019 level. The market may have added another 128,000 bedrooms if the oldest age group (80 to 90) had maintained its 2019 mobility rate, bringing the total to more than 500,000 when the two age groups are combined.
Table 1 presents the results of the counterfactual exercise. The first three columns show the household mobility rates by age group for 2019 and 2023 and the percentage difference between the two. Columns 4 and 5 show the number of bedrooms per household member in each year for each age group. Columns 6 through 10 relate to the counterfactual. Columns 6 and 7 show the estimated number of bedrooms that came on the market in each year based on my calculations using ACS data on the respective age group’s household mobility rate, household count, population, and bedrooms per household member for that year. Column 8 shows how many bedrooms may have become available in 2023 if each age group had moved at the same rate as it did in 2019. I estimate these values using the same data as in column 7, but I replace the respective 2023 mobility rates with the 2019 rates.
Column 9 presents the difference between the values in columns 7 and 8—the number of additional bedrooms that may have come on the market had the age groups maintained the pre-pandemic mobility rates. The last column presents, for each age group, the share of the “actual” 2023 value (the estimated value using the 2023 mobility rate) that these extra bedrooms represent.
Not surprisingly, the results indicate that across age groups, more bedrooms may have been available in 2023 if mobility rates had remained at their 2019 levels—nearly 2.5 million more in total. The 80–90 age group would have freed up the most bedrooms relative to the estimated number that they made available in 2023 (14.5 percent more).
Table 1 also shows that despite the decrease in mobility for the 65–79 age group, it still put an estimated 1,528 more bedrooms on the market in 2023 than in 2019 (column 7 minus column 6). This age group represents a fast-growing sector of the population—it increased from 41.3 million people in 2019 to 46.1 million in 2023—and that growth may mask the potential effects of its declining mobility on the number of available bedrooms. If the household count had remained the same as it was in 2019, the 65–79 age group may have put an estimated 349,142 fewer (11 percent less) bedrooms on the market in 2023 relative to the estimate of the actual number. For each of the other two age groups, the counterfactual number of bedrooms using the 2019 household count is just 5 percent less than the estimate of the actual number: 1,223,590 fewer bedrooms for the youngest category and 47,971 fewer for the 80–90 group.
Multigenerational Living and Housing Demand
Multigenerational living—usually arrangements in which parents and grown children and/or grandchildren share the same home—can provide many benefits to households, including lower housing costs as well as lower costs for childcare and eldercare. Relative to the 2011–2019 period, the most common types of multigenerational living have increased well above trend in recent years.
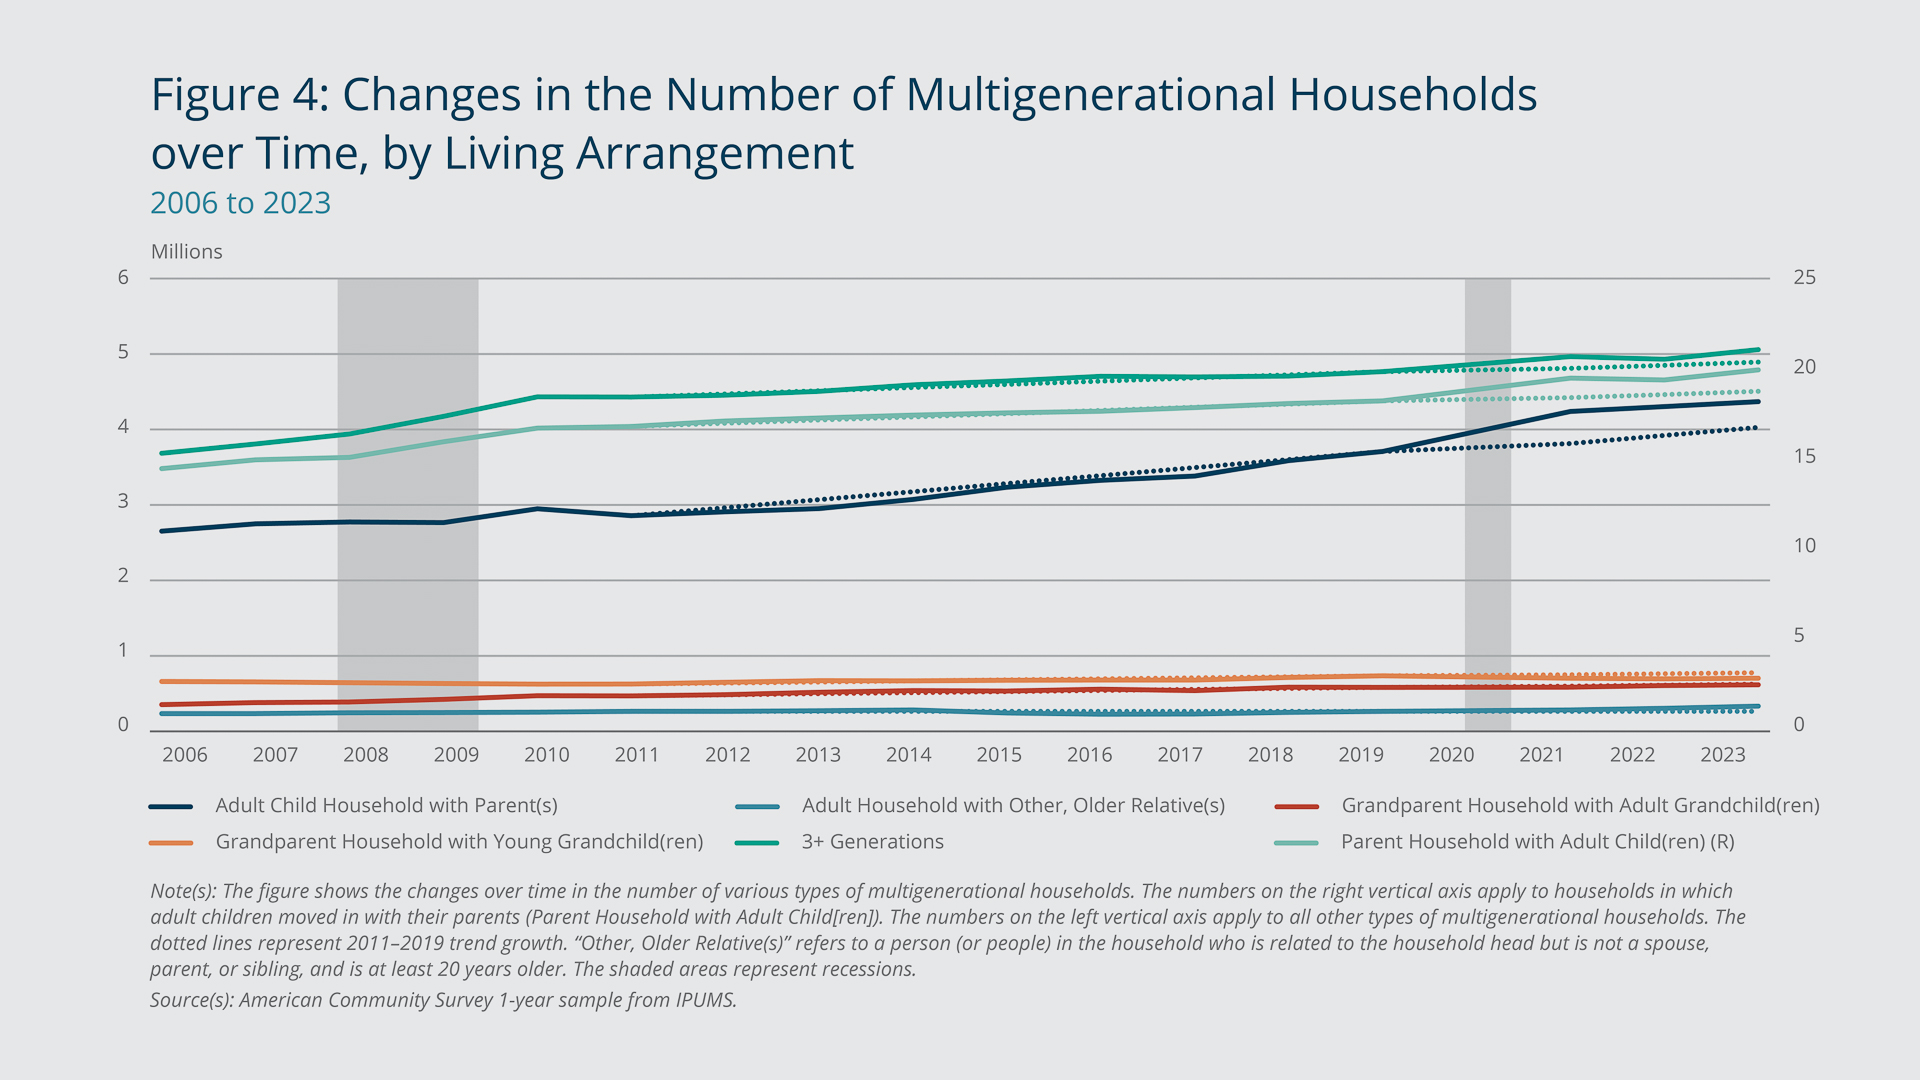
As Figure 4 shows, the number of households in which parents moved in with their adult children (green line) surged during and after the pandemic compared with the 2011–2019 trend (dotted lines). This is also the case for households in which adult children moved in with their parents (dark blue line) and the number of three-generation households (orange line). Those last two types of living arrangements also picked up during the financial crisis in the late 2000s, as young adults moved back home. Growth in the number of those two types of households roughly flattened from that period to 2019. The incidence of parents moving in with their adult children (green line) remained relatively unchanged during the 2008–2009 financial crisis. Trend growth in the number of such households has reflected a longer-run, slower-moving demographic shift involving adults taking care of their elderly parents.
The number of households in which adults live with their grandparents (black line) has been rising steadily since 2006, climbing to 616,976 households in 2023. The number of households in which a child or children live with their grandparent or grandparents (light blue line) exhibited a mostly upward trend from 2010 to the onset of the pandemic, when it declined, potentially due to pandemic-related health concerns. The number of households in which adults have taken in older relatives (at least 20 years older than the household head) other than their parents (purple line) has been low, but it did reach 334,250 households in 2023 after showing above-trend growth following the onset of the pandemic.
The extent to which the surge in the number of multigenerational households after 2019 has been a response to the pandemic or to the tight housing market is unclear. It is clear, however, that declining household mobility and increasing multigenerational living push in opposite directions with respect to housing availability. Less mobility of households living in homes with a surplus of bedrooms limits the availability of such homes, while additional multigenerational living reduces demand for housing in general. The question then is: How much are these two factors offsetting each other?
Analyzing trends involving adult children moving in with their parents can provide insight into the effect of multigenerational living on housing market conditions. Growth in the number of households in which adult children have moved in with their parents accelerated in 2021, when, based on pre-pandemic trend growth, there were 1,084,023 more of such households than would have been expected. In 2022 and 2023, the above-trend growth of such households was 798,531 and 1,182,756, respectively. Absent this recent accelerated growth, the adult children living in those 1 million or so homes may have added to the pressure on housing demand.
More Multifamily Homes and ADUs Are among Potential Solutions
As housing availability continues to present challenges, policymakers and researchers seek possible solutions. Due to the complexity of the housing market, no single policy action or reform will solve the current problems, but some have the potential to help reverse or at least slow the decline in household mobility among older adults.
Residential zoning policy reform has been proposed as a potential way to expand housing supply, particularly the supply of smaller housing units, which could appeal to older individuals seeking to downsize. Chiumenti and Sood (2022) find that relaxing density restrictions to allow more multifamily housing could increase the supply of smaller units and reduce multifamily rents.
One potential way to free up larger homes for households that need more bedrooms is to allow the construction of accessory dwelling units, or ADUs. An ADU is a separate, smaller living structure built on the same lot as an existing home. Some states are considering policies that would reduce restrictions related to ADUs. These housing units could provide additional space for larger multigenerational families, or older homeowners looking to downsize could move into ADUs and sell or rent their larger homes.
References
Andrew Haughwout, Donghoon Lee, Daniel Mangrum, Joelle Scally, and Wilbert van der Klaauw. 2023. “The Great Pandemic Mortgage Refinance Boom.” Liberty Street Economics (blog). Federal Reserve Bank of New York. May 15. https://libertystreeteconomics.newyorkfed.org/2023/05/the-great-pandemic-mortgage-refinance-boom/
Chiumenti, Nicholas, and Aradhya Sood. 2022. “Local Zoning Laws and the Supply of Multifamily Housing in Greater Boston.” Federal Reserve Bank of Boston New England Public Policy Center Research Reports No. 22-1. https://www.bostonfed.org/publications/new-england-public-policy-center-research-report/2022/local-zoning-laws-and-the-supply-of-multifamily-housing-in-greater-boston.aspx
National Association of Realtors (NAR). 2025. “2025 Home Buyers and Sellers Generational Trends Report.” https://www.nar.realtor/sites/default/files/2025-04/2025-home-buyers-and-sellers-generational-trends-04-01-2025.pdf
Data Source
Steven Ruggles, Sarah Flood, Matthew Sobek, Daniel Backman, Grace Cooper, Julia A. Rivera Drew, Stephanie Richards, Renae Rogers, Jonathan Schroeder, and Kari C.W. Williams. IPUMS USA: Version 16.0 [data set]. Minneapolis, MN: IPUMS, 2025. https://doi.org/10.18128/D010.V16.0

 About the Authors
Sam Shampine,
Federal Reserve Bank of Boston
Sam Shampine is a policy analyst with the New England Public Policy Center in the Federal Reserve Bank of Boston Research Department.
Email: Samantha.Shampine@bos.frb.org
Acknowledgments
The author thanks their colleagues at the New England Public Policy Center for their guidance and support.
Resources
Site Topics
Keywords
- household mobility ,
- multigenerational living ,
- housing market ,
- multifamily homes ,
- accessory dwelling units
JEL Codes
- R21 ,
- R31
Citation
Shampine, Sam. 2025. “Housing Trends: Older Households Are Moving Less, and Multigenerational Living Is Rising.” Federal Reserve Bank of Boston Current Policy Perspectives 25-9.