Recent Trends in Residential Segregation in New England 


| Key Facts | |
 |
Residential segregation in large New England metro areas declined 12 percent between 1990 and 2017. |
 |
Hispanic population growth drove that decline; Hispanics accounted for 64 percent of New England's total population growth between 1990 and 2017. |
 |
On average, white residents of New England metro areas live in neighborhoods that are 80 percent white. |
 |
Between 1990 and 2017, residential segregation increased 10 percent in the region’s small metro areas, most of which are located in northern New England. |
 |
|
Summary
Residential segregation in Boston has drawn considerable attention in recent years, but much less notice has been given to the issue with respect to the rest of New England. This regional brief focuses on residential segregation between all minority groups and non-Hispanic white residents in metro areas throughout the region. New England’s population is predominately non-Hispanic white; however, the region has diversified considerably since 1990, as most of the population growth has occurred among minority groups. Residential segregation by race/ethnicity declined over that same period in nearly every medium-sized and large metro area in New England, though the levels remain modestly higher than the national averages. Contrary to the broader trends, many of New England’s small metro areas saw increases in residential segregation during the 1990–2017 period. While racial and ethnic minorities in the region tend to be clustered in fewer neighborhoods relative to the rest of the United States, they are less isolated from non-Hispanic whites; that is, on average, a minority resident of a New England metro area has a considerably higher share of white neighbors compared with minorities elsewhere in the country.
Sign up for new research and data on the New England economy.
An Increasingly Diverse New England
For this report, “minority residents” refers to people who identify as belonging to at least one racial or ethnic group other than non-Hispanic white (for example Hispanic, black, or Asian). These include individuals who identify as multiracial or as Hispanic of any race. This report makes some references to specific minority groups in order to give context to or compare different experiences.1
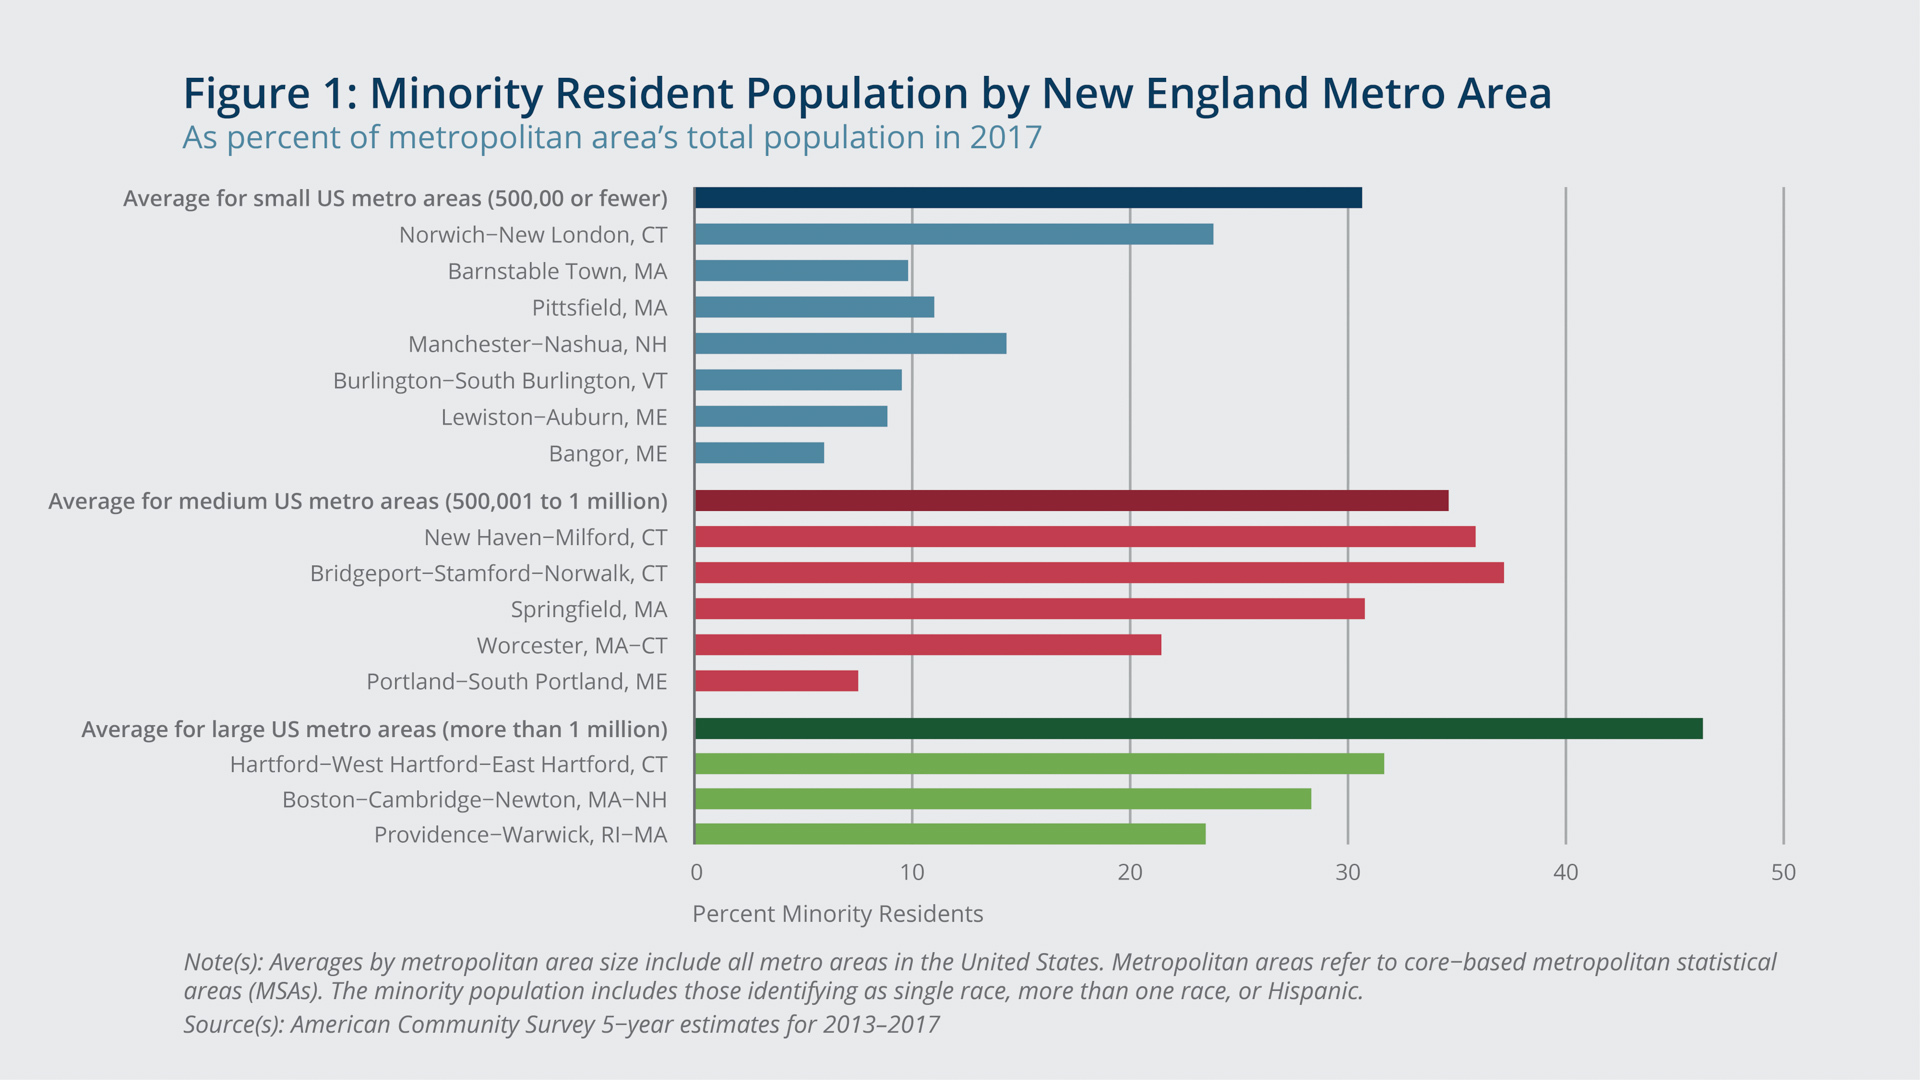
Compared with similarly sized metropolitan areas elsewhere in the United States, those in New England generally are home to fewer minority residents.2 Figure 1 shows the share of New England metro area residents in 2017 who identified as belonging to any minority group. For every small (500,000 or fewer residents) and large (more than 1 million residents) metro area in the region, the share of minority residents was less than the average for all similarly sized US metro areas. In all but two of New England’s medium-sized metro areas (500,001 to 1 million residents) the share of minority residents was smaller than the average share for similarly sized metro areas nationwide. The exceptions were New Haven-Milford (Connecticut) and Bridgeport-Stamford-Norwalk (Connecticut), where the share of minority residents was even greater than those of every large New England metro area. Metro areas in Maine, New Hampshire, and Vermont had the smallest shares of minority residents, ranging from just under 6 percent in Bangor (Maine) to 14.3 percent in Manchester-Nashua (New Hampshire).

Alex Cronin/Federal Reserve Bank of Boston
New England metro areas have diversified considerably over the past three decades. Since 1990, the minority population in these areas has more than doubled. Within metro areas, the minority-population growth between 1990 and 2017 ranged from 105.7 percent in Hartford (Connecticut) to 360 percent in Lewiston-Auburn (Maine). Smaller metro areas in northern New England saw some of the largest increases by percentage; however, the minority population in these areas remains small in comparison with those of southern New England metro areas.
Every New England state saw an increase in its non-white population between 1990 and 2017, and the region as a whole saw an increase of 144 percent. The number of minority residents more than doubled in Connecticut, Massachusetts, and Rhode Island; tripled in Maine; and quadrupled in New Hampshire and Vermont. The increase in the Hispanic population was responsible for 64 percent of the total population growth in New England between 1990 and 2017; non-Hispanic black residents accounted for 21 percent of the region’s population gains during this period. As a result, the New England population went from being 89 percent white in 1990 to 76 percent white in 2017.
Residential Segregation of Minorities
Rates of residential segregation have been on the decline nationally since at least the 1980s.3 Medium-sized and large metropolitan areas in Massachusetts, Rhode Island, and Connecticut mirrored this decline between 1990 and 2017; however, their rates of decline were generally slower than the national average. This finding is based on a measure of residential segregation called the dissimilarity index.4 The index represents the percentage of minority residents who would need to move to another neighborhood (in this case census tract) within a metro area in order for all neighborhoods to have an equal share of minorities.5 A lower percentage indicates a more even distribution of minority residents across an area and thus less residential segregation; a higher percentage indicates a minority population that is highly concentrated in a certain neighborhood or neighborhoods. Table 1 shows each New England metro area’s dissimilarity index for the entire minority population relative to its white population.
In 2017, six of the eight medium-sized and large New England metro areas had rates of residential segregation that were higher than the national average for similarly sized metro areas. Based on the dissimilarity index, Bridgeport-Stamford-Norwalk (Connecticut) had the highest rate in 2017. In that year, about 53 percent of minority residents would have had to move in order for all neighborhoods in the metro area to have an equal share of minority residents.6 Conversely, New England’s small metro areas tended to have lower-than-average rates; residential segregation was greater than the national average in only two of its seven small metro areas: Manchester-Nashua (New Hampshire) and Norwich-New London (Connecticut).
Even though Connecticut metro areas had the highest rates of residential segregation, the state saw some of the steepest declines in New England between 1990 and 2017. Hartford’s dissimilarity index fell 17 percent, and in New Haven-Milford, it decreased 18 percent, the most of any New England metro area during this period. In other New England states’ metro areas where the rates declined, they tended to do so at a pace that was slower than the national average. The main exception here was the Boston-Cambridge-Newton (Massachusetts-New Hampshire) metro area, where the dissimilarity index also fell slightly faster than the national average.
During this period, the dissimilarity index of large US metro areas fell 13.1 percent on average, a drop slightly larger than the 12.6 percent decline in New England’s large metro areas. Nationally, the index for medium-sized and small metro areas fell an average of about 16 percent and 11 percent, respectively, but in New England, the decline was only 9.8 percent in medium-sized metro areas, while in small metro areas the index increased 10.1 percent on average.
Table 1: Residential Segregation of All Minorities Relative to White Residents
By New England metropolitan area, 1990–2017 Metropolitan area (MSA)
| Metropolitan area (MSA) | 1990 | 2000 | 2010 | 2017 |
| Large metro areas (more than 1 million residents) | ||||
| Hartford-West Hartford-East Hartford, CT | 60.8 | 56.5 | 52.1 | 50.5 |
| Providence-Warwick, RI-MA | 53.8 | 3.2 | 50.2 | 50.4 |
| Boston-Cambridge-Newton, MA-NH | 55.7 | 53.6 | 49.7 | 48.2 |
| Average for large US metro areas | 55.7 | 52.7 | 48.9 | 48.4 |
| Medium metro areas (500,001 to 1 million residents) | ||||
| Bridgeport-Stamford-Norwalk, CT | 59.6 | 58.4 | 55.3 | 53.2 |
| Springfield, MA | 59.3 | 56.5 | 55.5 | 53.1 |
| New Haven-Milford, CT | 58.9 | 55.4 | 51 | 48.4 |
| Worcester, MA-CT | 47 | 46.1 | 43.8 | 42.7 |
| Portland-South Portland, ME | 27.3 | 26.6 | 27.8 | 33.1 |
| Average for medium US metro areas | 48.4 | 45 | 41.6 | 41.1 |
| Small metro areas (500,000 or fewer residents) | ||||
| Norwich-New London, CT | 41.7 | 41 | 40.5 | 39.4 |
| Manchester-Nashua, NH | 28.2 | 35.8 | 34.9 | 38.1 |
| Bangor, ME | 33.8 | 29.4 | 22.8 | 34.1 |
| Pittsfield, MA | 30.6 | 27.8 | 29.3 | 31.8 |
| Burlington-South Burlington, VT | 22 | 22.5 | 24.3 | 30.2 |
| Barnstable Town, MA | 31.6 | 27.1 | 24.8 | 29.5 |
| Lewiston-Auburn, ME | 23.2 | 19.8 | 35.4 | 27.6 |
| Average for small US metro areas | 41.7 | 38.6 | 35.8 | 37.2 |
| Note(s): Table displays the dissimilarity index for all minority groups relative to non-Hispanic whites in New England metro areas. Values represent the percent of minority residents who would need to move out of their neighborhood (census tract) and into another within the same metro area in order for every neighborhood within that metro area to have an equal share of minority residents. Metropolitan areas were excluded if less than 3 percent of their population identified as a minority group. Averages include all metro areas in the United States by population size. Source(s): Decennial census 1990–2010; American Community Survey 5-year estimates for 2013–2017 |
||||
Northern New England and southern New England appear to have been on divergent paths between 1990 and 2017. Metro areas in Maine, New Hampshire, and Vermont all saw their rates of residential segregation rise (according to the dissimilarity index), while those in southern New England, with the exception of the Pittsfield metro area (Massachusetts), saw theirs decline. One factor that may help to explain this divergence is the different demographic changes these areas experienced. In Maine, New Hampshire, and Vermont metro areas, the number of non-Hispanic white residents remained the same or grew between 1990 and 2017; in every southern New England metro area where residential segregation declined, the number of white residents also fell.7 Thus, in southern New England, predominantly white neighborhoods may have desegregated in part because, with white residents departing, it was more likely that only minority buyers or renters competed for available housing. These demographically driven changes were not present in northern New England.
In metro areas with smaller shares of minority residents, it can be difficult to accurately estimate the dissimilarity index.8 In 2017, fewer than 10 percent of northern New England’s metro area residents were minorities. Because the dissimilarity index conveys the share of minority residents who have to move within a metro area, large changes in residential segregation can occur in places with smaller minority populations when relatively few minority residents relocate from one neighborhood to another. Thus in many northern New England metro areas, the changes in residential segregation between 1990 and 2017 may have been the result of the relocation of a relatively small number of minority residents. In addition, the 2017 estimates are based on a sample of residents from the American Community Survey (ACS), as opposed to the estimates from earlier years, which use the decennial census (a full count of residents). The 2017 estimates for areas with smaller minority populations have larger margins of error, so the actual changes in residential segregation may vary from these estimates.
Despite data limitations for small metro areas, evidence indicates that residential segregation has been rising in northern New England, including during the 1990–2010 period, for which the more accurate full-count census data are used. With the exception of Bangor (Maine),9 all northern New England metro areas that saw their minority and non-Hispanic white populations grow during this period also saw an increase in residential segregation. Lewiston-Auburn (Maine) was the only metro area that experienced a decline in the number of non-Hispanic white residents along with an increase in residential segregation between 1990 and 2010. All medium-sized and large metro areas where the dissimilarity index fell between 1990 and 2010 also had a decline in their non-Hispanic white population but an increase in their minority population.
Neighborhood Diversity in New England
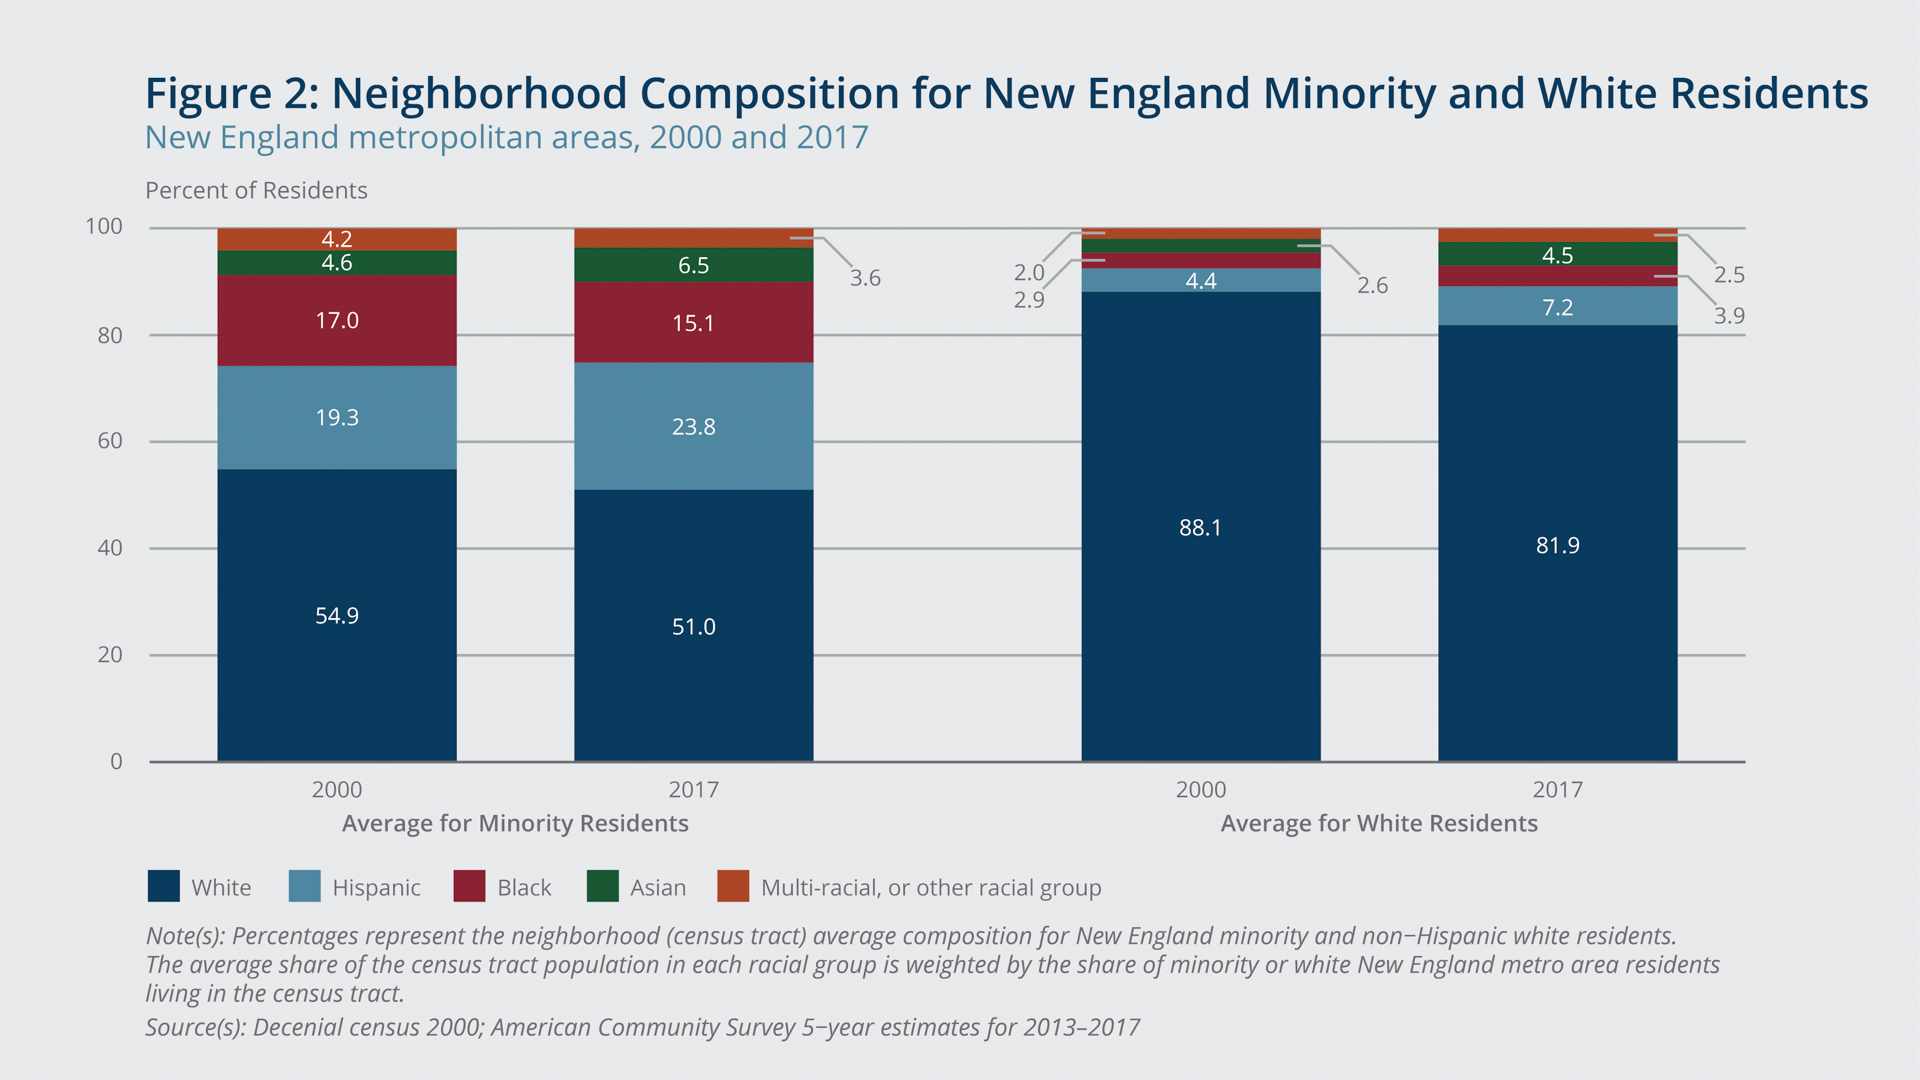
While minority residents of New England metropolitan areas experience somewhat greater residential segregation, being clustered into fewer neighborhoods compared with minority residents of other US metro areas, they are also more likely to live alongside a greater number of non-Hispanic white residents and are thus less “isolated” from them. In 2017, the neighborhood of a minority resident of a New England metro area, on average, was 51 percent white (Figure 2), compared with only 36 percent white in metro areas outside of the region. In part, this is because non-Hispanic whites make up a larger share of the population in New England than in the country as a whole. The neighborhood of a white resident of a New England metro area, however, usually looks quite different from a minority resident’s neighborhood; on average, in 2017 only 18.1 percent of a white resident’s neighbors were minorities. In the average metro area outside of New England, a white resident lives in a neighborhood where slightly more than one-fourth (27 percent) of the residents are minorities.
Alex Cronin/Federal Reserve Bank of Boston
Since 2000, the average racial composition of New England metro area neighborhoods has changed. The share of non-Hispanic white neighbors has declined for minority residents, as well as for white residents, dropping, on average, 4 percentage points for a minority resident and 6 percentage points for a white resident. In both cases, the shift is primarily due to an increase in the number of Hispanic residents and, secondarily, to the rise in the number of Asian residents. Between 2000 and 2017, the Hispanic share of residents climbed 4.5 percentage points in the neighborhood of a minority resident and 2.8 percentage points in the neighborhood of a white resident, on average. In the neighborhoods of each, the Asian share of the population rose an average of 1.9 points.
For New England metro areas, the declining share of white residents living in the neighborhood of a minority resident is consistent with declining residential segregation, which may seem counterintuitive. However, as previously noted, the region is diversifying; the share of the overall population of New England’s metro areas that is non-Hispanic white fell 10.3 percent between 2000 and 2017. But during that period, the share of white residents living in the neighborhood of a minority resident declined only 7.1 percent, on average. Thus in 2017, the average racial and ethnic makeup of a minority resident’s neighborhood more closely resembled the region as a whole than it did in 2000.
Obstacles to Future Declines in Residential Segregation
Changing demographics helped facilitate declines in residential segregation, but these trends are not guaranteed to continue. From 2000 to 2010, the minority population in a white resident’s neighborhood increased, on average, 5 percent annually. Meanwhile, in the neighborhood of a minority resident, the minority population increased only 3.7 percent annually, on average. While seemingly not large, this difference compounded over the decade and was also evident in the preceding 10-year period.10 However, the 2010–2017 period saw a reversal of this trend; the minority population of a minority resident’s neighborhood grew faster than the minority population of a white resident’s neighborhood, increasing, on average, at annual rates of 2.4 percent and 2.1 percent, respectively. These numbers suggest that the minority populations in predominantly white neighborhoods grew at a slower pace in recent years, and that new minority residents to New England metro areas are moving into predominantly minority neighborhoods.
The continuation of these patterns could disrupt the region’s long-term trend toward declining residential segregation. The reasons for this shift in the most recent period are not clear, but rising home prices and an inadequate supply of housing may be at least partly to blame for the slower minority population growth seen in predominantly white neighborhoods. As problems of housing affordability continue, and potentially worsen, future progress toward residential integration will be at risk, because fewer minority households will be able to afford to live in neighborhoods where white households live. While lending practices no longer overtly discriminate against minority buyers as they once did, the cost of borrowing remains higher—and loan terms less favorable—for minority households.11 Housing affordability looms large as an important barrier to residential integration. The effects of an insufficient supply of housing and the related restrictive zoning practices are increasingly acknowledged as exacerbating this issue.12 New England’s minority residents disproportionately experience the consequences of housing unaffordability, and an absence of affordable housing options will make it more difficult to further reduce residential segregation.
Concluding Remarks
Residential segregation between minority and non-Hispanic white residents in New England’s more populated southern metro areas is declining, and it has been since at least 1990, mirroring a national trend. In these communities at least, changing demographics are likely playing an important role, as the Hispanic population has increased dramatically over the past three decades, and new minority residents have been responsible for all of the net population growth in southern New England’s metropolitan areas. Thus, in southern New England, declining residential segregation may be, in part, a natural outcome of a diversifying region, as new demand for available housing has been more likely to come from minority residents in recent years. In northern New England’s metro areas, residential segregation increased between 1990 and 2017. The demographic trends present in southern New England that have facilitated residential integration were not present in northern New England during this period. Before 2010, trends involving where minority residents chose to live were favorable to declining residential segregation in the region’s metro areas, but those trends seem to have shifted in recent years, with minorities more likely to settle in predominantly minority neighborhoods.
Data Sources
Steven Manson, Jonathan Schroeder, David Van Riper, and Steven Ruggles. IPUMS National Historical Geographic Information System: Version 13.0 [Database]. Minneapolis, MN: University of Minnesota. 2018.
The data used in this report are from the US Census Bureau’s American Community Survey 5-Year Estimates 2013–2017 and the US Census Bureau 1990, 2000, and 2010 Decennial Censuses. The geography considered are New England area census tracts within US Office of Management and Budget metropolitan core based statistical areas.

 About the Authors
Nicholas Chiumenti
Endnotes
- References to racial groups in this report refer to persons who identify as a single race. For example “black residents” refers to persons who identify as black or African American only and not in combination with another race (multi-race). Hispanics are treated as a separate minority group, even though Hispanics are identified in combination with a race by the US Census Bureau.
- Metropolitan areas refer to Core Based Metropolitan Statistical Areas (MSAs), as defined by the US Office of Management and Budget. Micropolitan Core Based Statistical Areas are excluded from this analysis.
- Iceland, John, Daniel H. Weinberg, and Erika Steinmetz. 2002. Racial and Ethnic Segregation in the United States: 1980–2000. Special Reports CENSR-3. US Census Bureau. Washington, DC.
- Massey, Douglas S., and Nancy A. Denton. 1988. “Dimensions of Residential Segregation.” Social Forces 67(2): 281–315.
- Standardized census tracts were used in order to compare measures of residential segregation across years.
- Alternatively, 53.2 percent of non-Hispanic white residents could relocate to achieve this same distribution.
- The decrease in the white population in medium-sized and large southern New England metro areas between 1990 and 2017 ranged from 6.3 percent in Providence-Warwick (Rhode Island) to 17.8 percent in New Haven-Milford (Connecticut). Meanwhile the increase in the number of minority residents ranged from 105.7 percent in Hartford (Connecticut) to 204.2 percent in Worcester (Massachusetts-Connecticut). The Portland (Maine) metro area is the one medium-sized or large metro area where residential segregation increased during this period; its white population grew 12.7 percent, while the minority population increased 303.2 percent. There are three exceptions to this trend of a declining white population coupled with declining residential segregation. In Barnstable Town (Massachusetts), the number of white residents increased 8.4 percent between 1990 and 2017, but residential segregation declined 6.6 percent during this period. In Pittsfield (Massachusetts), the number of white residents declined 15.3 percent, but residential segregation increased 3.9 percent. Residential segregation also increased in Lewiston-Auburn (Maine), even while the white population decreased 5.2 percent.
- Allen, Rebecca, Simon Burgess, Russell Davidson, and Frank Windmeijer. 2015. “More Reliable Inference for the Dissimilarity Index of Segregation.” Econometrics Journal 18(1): 40–66.
- Bangor (Maine) had a decline in residential segregation during this period coupled with increasing minority and white populations. However, this metro area may be most susceptible to small sample size issues.
- From 1990 to 2000, the number of minority residents increased an average of 6.4 percent annually in a white resident’s neighborhood, but only 6 percent, on average, in a minority resident’s neighborhood.
- Bayer, Patrick, Fernando Ferreira, and Stephen L. Ross. 2017. “What Drives Racial and Ethnic Differences in High Cost Mortgages? The Role of High Risk Lenders.” The Review of Financial Studies 31(1): 175–205.
- Rothwell, Jonathan T., and Douglas. S. Massey. 2010. “Density Zoning and Class Segregation in U.S. Metropolitan Areas.” Social Science Quarterly 91(5): 1123–1143.
Resources
Site Topics
Keywords
- New England ,
- segregation ,
- metro areas ,
- NEPPC
Related Content
Retaining Recent College Graduates in New England: An Update on Current Trends
Economic Conditions and Recent Trends in New England and Southern Vermont
Recent Migration and Visa Trends in New England and Implications for the Labor Market
Recent Trends in Infrastructure Investment and Capacity in New England