Measuring Poverty: Who Is Poor? 


Before the 1800s — back before government, nonprofit foundations, and think tanks began to involve themselves in large-scale antipoverty initiatives — there was little interest in measuring poverty, mainly because there was no real need for measurement. For most of human history religious organizations, local politicians, and the landed gentry dispensed small amounts of largesse to those who were lucky enough to gain favor or notice.
Even the charitable efforts of 19th century antipoverty reformers were smaller-scale local operations that mostly provided meals, clothing, and other forms of aid directly to needy people in a defined area. Donors to those charities rarely required more than a rough tally of meals served or people helped.
In 1869 Massachusetts established the first labor statistics bureau with a goal of using government statistics to help improve the lives of working class families. And in 1900, the English chocolatier and social researcher Benjamin Seebohm Rowntree published Poverty: A Study in Town Life, based on statistical research he had undertaken in York. But for the most part, efforts to define and measure poverty did not gain momentum until the 1930s, when the federal government engaged in large-scale relief efforts aimed at easing the effects of the Great Depression, and then later in the 1960s, when President Lyndon Johnson declared war on poverty.
You Know You're Poor If …
Some call it the "poverty line," others refer to it as the "poverty threshold." In either case, there is general agreement that Mollie Orshansky, a statistician at the Social Security Administration, developed the federal government's first widely used measure of poverty. This is how it happened:
By 1963, Orshansky was working for the Social Security Administration – the agency that oversees many social safety net programs – and was assigned to report on "poverty as it affects children." But her team had no good measure of what constituted poverty – so Orshansky decided to develop her own.
She used a 1955 Department of Agriculture report which found that families of three or more spent about one third of their after-tax income on food. So, to calculate a poverty line Orshansky decided to multiply a low-income household's food budget by three, figuring that if a family was tightening its belt, it would cut all expenses by about the same amount, proportionately.
For the food budget itself, Orshansky used the Department of Agriculture's "economy food plan." It was the cheapest of four plans developed by the Department of Agriculture, and was designed to reflect what a family living for a short period of time on a severely constrained budget might need to get by. In 1962, it allotted $18.60 a week for a family of four with two school-aged children—or $143.47 in today's dollars. It was even less costly than two other "low cost" plans the department had developed, and, as a 1962 report explained, "relie[d] heavily on the cereals, dry beans, peas, and nuts and potato groups, and on the selection of the less expensive items in each of the 11 food groups." It was only for "emergency use," and not intended to constitute a family's diet over the long-term. In a 1965 article, Orshansky said her threshold, dependent on this budget, should be used to measure when a family had "inadequate" funds, not adequate funds.
Her new standard came at a fortuitous time. The Johnson administration had declared a "war on poverty," and public agencies needed a way to measure the extent of the problem. In 1965, the Office of Economic Opportunity adopted Orshansky's thresholds as their poverty cut-off, and in 1969, her thresholds were made the government's official definition of poverty.
Excerpt from: http://billmoyers.com/2013/09/18/why-is-thefederal-poverty-line-so-low/
Aside from updates for inflation, the federal poverty threshold has changed little since the 1960s, and that has been a point of contention. The most frequent criticism is that the federal poverty threshold counts only cash income and does not take into account programs intended to counter the effects of poverty programs such as the Supplemental Nutrition Assistance Program (SNAP) or the Earned Income Tax Credit.
Even Orshansky herself had reservations. "The best that can be said about the measure," she once wrote, "is that at a time when it seemed useful, it was there." [16]
In addition to the federal poverty threshold, there are federal poverty guidelines. The Federal Poverty Guidelines (Federal Poverty Levels, FPL) are the official measure of the minimum income needed to meet the basic needs of individuals and families. The amounts are often used to set eligibility and benefits for public programs. But numerous studies have documented that the FPL is an outdated and inaccurate reflection of the actual incomes families need. It is also a poor metric to identify the economic needs of custodial grandparents. [17] A detailed explanation of the difference between the threshold and guidelines is available here.
The Supplemental Poverty Measure (SPM) was developed to address FPL shortcomings, but being based on current spending, it doesn't necessarily measure actual need. It includes people who spend only $100 on food per month, but that amount may represent food insecurity. A better way to measure economic security is to capture the actual costs associated with basic needs, such as shelter, food, health care, and transportation. [18]
The Poverty Rate and the Supplemental Poverty Measure, New England and the U.S., 2012
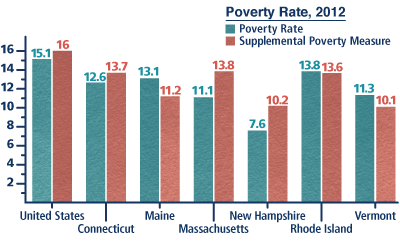
Source: Federal Reserve Bank of Boston, based on U.S. Census Bureau data.
Despite acknowledged shortcomings, proposals to change the federal poverty threshold and other federal poverty measures have run up against political pushback and disagreements over how to define poverty. The following online resources provide clear,concise summaries of the complexities involved … and they spare us the danger of navigating those particular political and ideological shoals:
- How the Census Bureau Measures Poverty
U.S. Census Bureau
https://www.census.gov/hhes/www/poverty/about/overview/measure.html - How is poverty measured in the United States?
Institute for Research on Poverty, University of Wisconsin-Madison
http://www.irp.wisc.edu/faqs/faq2.htm - Why is the federal poverty line so far off?
John Light, Moyers & Company
http://billmoyers.com/2013/09/18/why-is-the-federal-povertyline-so-low/ - Measuring Poverty in the United States
Nancy K. Cauthen and Sarah Fass, National Center for Children in Poverty, Columbia University
http://www.nccp.org/publications/pub_825.html - What's the Best Way to Measure Poverty: Income
or Consumption?
Matthew Philips, Freakonomics blog
http://freakonomics.com/2011/09/14/whats-the-best-way-tomeasure-poverty-income-or-consumption/ - The Mismeasure of Poverty
Sheldon H. Danziger, The New York Times, September 17, 2013
http://www.nytimes.com/2013/09/18/opinion/the-mismeasureof-poverty.html
There are also a variety of alternative measures that seek to evaluate well-being rather than trying to define poverty:
- The Genuine Progress Indicator (GPI) focuses on "the quality of life we create not only for ourselves but for everyone with whom we share the planet" by measuring factors such as crime and family breakdown, household and volunteer work, income distribution, and pollution.
- The Human Development Index (HDI) offers a global perspective on the question of how well people are living. Devised by the United Nations in the 1990s, the HDI is a composite of three different indicators: (1) life expectancy at birth, (2) education as measured by a combination of school enrollment and adult literacy, and (3) standard of living as measured by a variation on GDP per capita that adjusts for price differences between countries (purchasing power parity in U.S. dollars).
- Index of Social Health is "a broad-based gauge of the social well-being of the nation, similar in concept to the Dow Jones Average or the Gross Domestic Product." Published annually since 1987, the index uses government data for 16 social indicators to create profiles and rankings for all 50 states. In 2008, Minnesota ranked number one with a score of 75 out of 100, and New Mexico finished at the bottom with a score of 26.8.
- The Elder Economic Security Standard Index is an evidence-based measure of economic security that reflects the current actual cost of basic needs at the county level for retired adults age 65 and over, who receive no public assistance. The index was developed by Wider Opportunities for Women and the University of Massachusetts, Boston, Gerontology Institute to address the failings of the FPL for older adults. The UCLA Center for Health Policy Research and the Insight Center for Community Economic Development adapted the index and calculated it for California. As of September 2011, California law requires Area Agencies on Aging to use the index for program and planning purposes.
 collapse all
 expand all